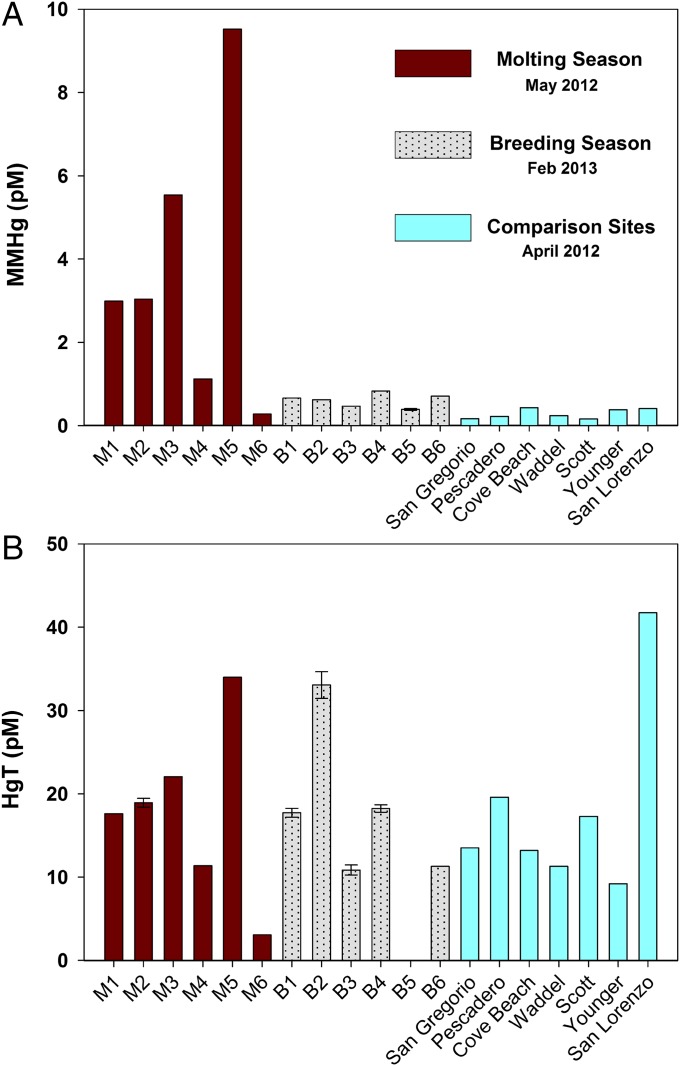
Fig. 2.
MeHg and HgT in nearshore unfiltered seawater samples. (A) MeHg concentrations for the Año Nuevo mainland rookery during the 2012 molting season (M1–M6), 2013 breeding season (B1–B6), and Central California comparison sites. (B) HgT concentrations for the rookery during the 2012 molting season, 2013 breeding season, and Central California comparison sites. Error bars (±1 SD) indicate the sample was analyzed at least three times. HgT for B5 (1,650 pM) was considered contaminated and is not graphed.

