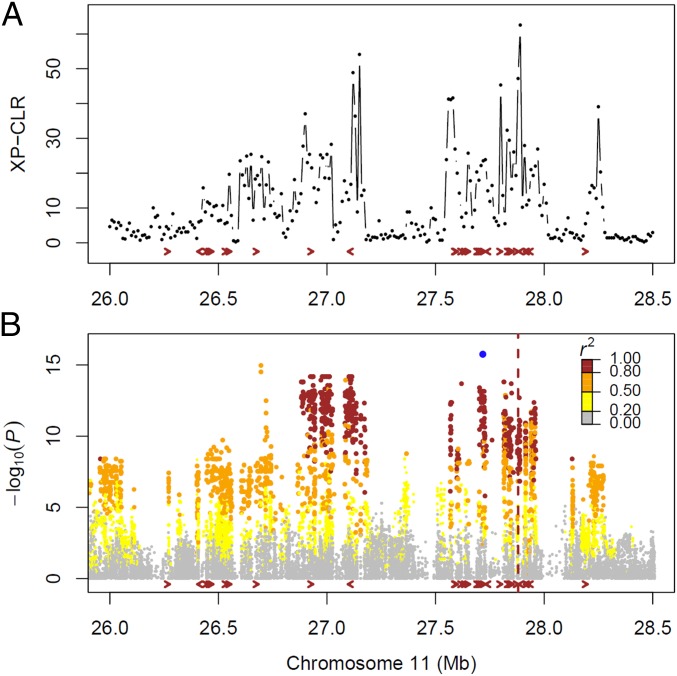
Fig. 3.
Differential selection on chromosome 11 illustrated with the XP-CLR and GWAS results near the Xa4 and Xa26 regions (from 26.0 to 28.5 Mb on chromosome 11). (A) XP-CLR result by using IndI as the reference population and IndII as the object population. (B) Associations using the LMM on lesion length of a Xoo strain, PXO341. The blue point denotes the lead SNP sf1127718069 (P = 1.9 × 10⁻¹⁶). The colors of the other points represent the amounts of linkage disequilibrium for the lead SNP. Each arrow represents a receptor protein kinase gene. The vertical dashed line indicates the position of Xa26. Although Xa4 has not been cloned, a study has reported that it is tightly linked to Xa26 (18).

