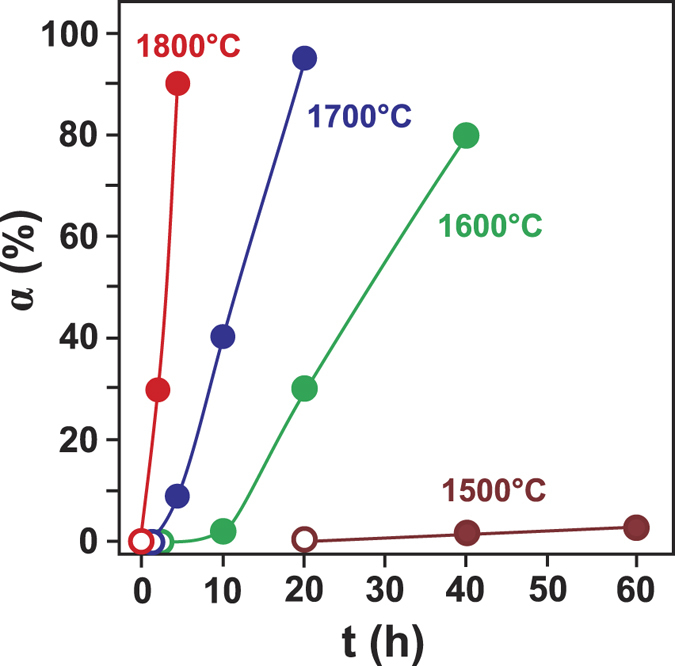
Figure 2. Kinetics of diamond crystallization.

Degree of the graphite-to-diamond transformation (α, %) is plotted versus reaction time (t, h) for experiments at 7 GPa and 1,500–1,800 °C. Open symbols refer to experiments where no spontaneous diamond nucleation was observed.
