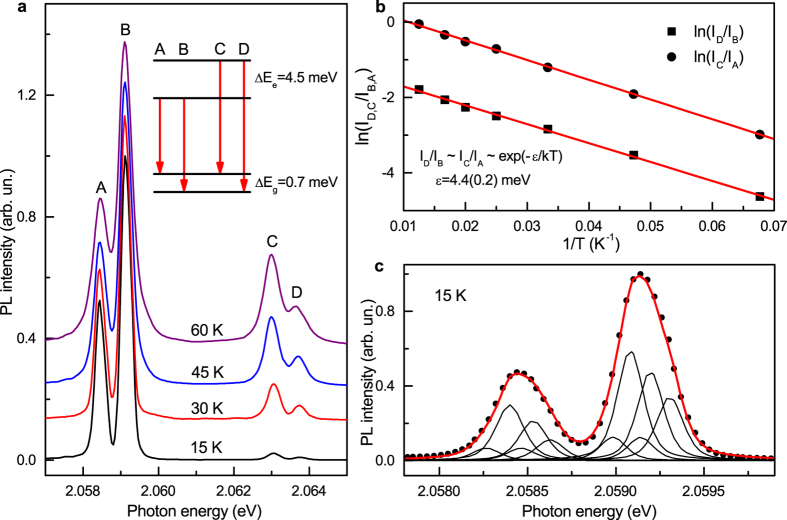
Figure 4. Spectroscopic characteristics of the 2.059 eV optical centre.
(a) Photoluminescence spectra measured at different temperatures. Letters A–D are used to label the components of the ZPL system. The spectra are normalized to the intensity of line B and shifted vertically for clarity. Inset shows a proposed energy-level diagram. ΔEg and ΔEe are the spectral energy separations for the ground and excited states, respectively. (b) Logarithmic plot of ratios of luminescence line intensities ln(ID/IB) (squares) and ln(IC/IA) (circles) versus 1/T. Lines through the data points are least-squares linear fits, which give activation energy ε of 4.4 ± 0.2 meV. This value is in good agreement with the observed spectroscopic splitting in the excited state. (c) Photoluminescence spectrum recorded at 15 K (dots) showing asymmetric shape of zero-phonon lines A (2.0854 eV) and B (2.0591 eV). Curve through the data points is a fit to five peaks for each line. The fitting peaks are pseudo-Voigt functions and their relative intensities are fixed to the ratio of the five stable Ge isotopes abundances.

