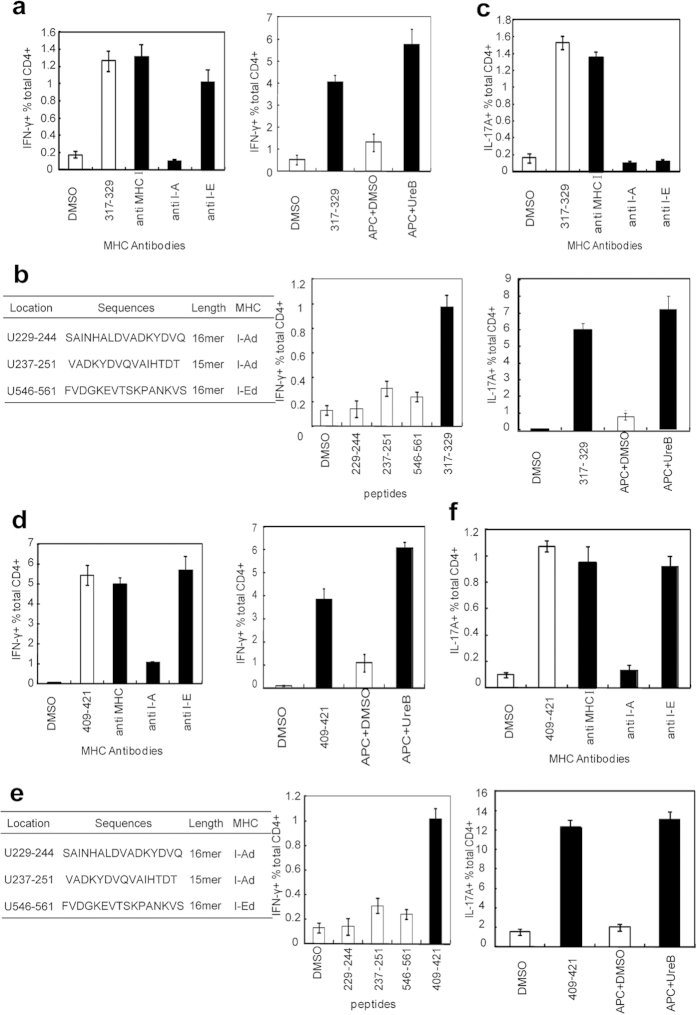
Figure 3. Detailed characterization of immunodominant anti-UreB CD4+ T-cell responses.
(a) MHC antibodies were used to identify the restriction profile of the Th1 epitope UreB317–329 (left). Natural processing and presentation of the novel Th1 epitope UreB317–329 by DCs (right). (b) Information of the three Th1 peptides predicted using a bioinformatics approach, including the location, amino acid sequences, length and MHC restriction profiles confirmed in our previous study (left). IFN-γ-producing CD4+ T-cell responses induced by UreB317–329 and the predicted peptides were analyzed (right). (c) MHC antibodies were used to identify the restriction profile of UreB317–329 epitope-specific Th17 responses (up). Natural processing and presentation of the epitope UreB317–329 inducing CD4+ T cells secreting IL-17A (down). (d) The MHC restriction profile for UreB409–421 inducing Th1 responses was determined using MHC antibodies (left). Natural processing and presentation of the epitope UreB409–421 inducing CD4+ T cells secreting IFN-γ (right). (e) Information of the three Th1 peptides predicted using a bioinformatics approach (left). IFN-γ-producing CD4+ T-cell responses induced by UreB409–421 and the predicted peptides were analyzed (right). (f) The MHC restriction profile for UreB409–421 inducing Th17 responses was determined using MHC antibodies (up). The natural processing and presentation of the epitope UreB409–421 induced CD4+ T cell secretion of IL-17A (down). The results were repeated five times. The data are expressed as the mean ± S.D (n = 10).

