
Figure 3. Validation of the gene expression changes before and after extensive weight loss.
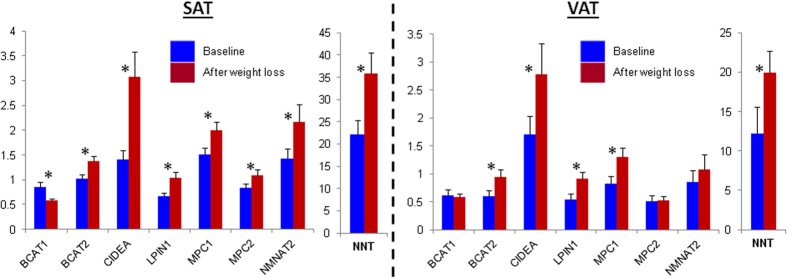
The expression levels of CIDEA and LPIN1 involved in the formation of lipid droplets, BCAT1 and BCAT2 involved in the catabolism of the branch chain amino acids, NMNAT2 involved in the NAD+ salvage pathway, NNT involved in the glutathione synthesis and MCP1 and MCP2 involved in the transport of pyruvate to the mitochondria before and after extensive weight loss were calculated by quantitative RT-PCR. Each bar represents the results from before and after extensive weight loss for 16 SAT and VAT samples, and mean ± standard error of the mean (SEM) values are presented. *Student’s t test was used and P-value < 0.05 was considered statistically significant.