Fig. 4.

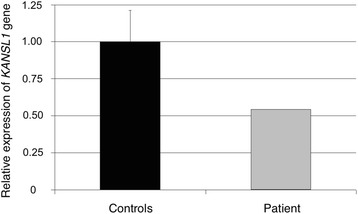
Quantification of KANSL1 gene expression levels by qRT-PCR. The expression level of KANSL1 gene on the patient bearing the t(1;17) (grey bar) was half that observed in the control group (black bar)

Quantification of KANSL1 gene expression levels by qRT-PCR. The expression level of KANSL1 gene on the patient bearing the t(1;17) (grey bar) was half that observed in the control group (black bar)