. 2015 Sep 8;4:e08504. doi: 10.7554/eLife.08504

Figure 1. Structure of RPo.

(A) Oligonucleotides used for RPo crystallization. The numbers above denote the DNA position with respect to the transcription start site (+1). The DNA sequence is derived from the full con promoter (Gaal et al., 2001). The −35 and −10 (Pribnow box) elements are shaded yellow, the extended −10 (Keilty and Rosenberg, 1987) and discriminator (Feklistov et al., 2006; Haugen et al., 2006) elements purple. The nt-strand DNA (top strand) is colored dark grey; t-strand DNA (bottom strand), light grey; RNA transcript, red. (B) Overall structure of RPo. The nucleic acids are shown as CPK spheres and color-coded as above. The Taq EΔ1.1σA is shown as a molecular surface (αI, αII, ω, grey; β, light cyan; β′, light pink; Δ1.1σA, light orange), transparent to reveal the RNAP active site Mg2+ (yellow sphere) and the nucleic acids held inside the RNAP active site channel. (C) Electron density and model for RPo nucleic acids. Blue mesh, 2FoFc maps for nucleic acids (contoured at 0.7σ).

DOI: http://dx.doi.org/10.7554/eLife.08504.003

Figure 1.

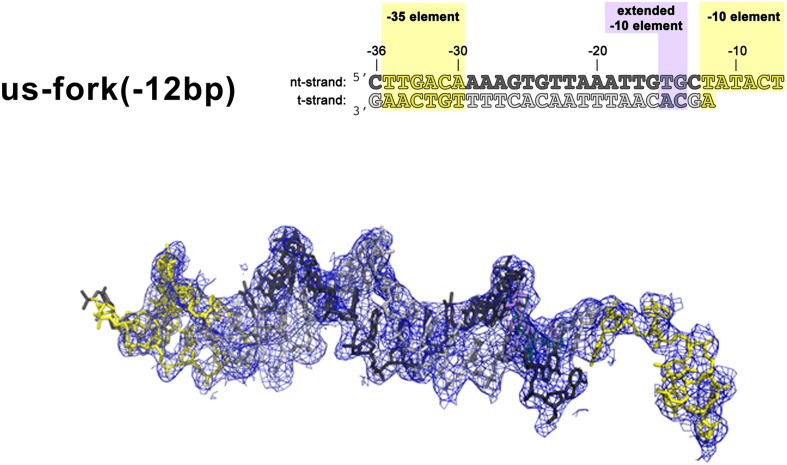
Figure 1—figure supplement 1. (Left) Synthetic oligonucleotides used for us-fork (−12 bp) crystallization.

Figure 1—figure supplement 1.

The numbers above the sequence denote the DNA position with respect to the transcription start site (+1). The DNA sequence is derived from the full con promoter (Gaal et al., 2001). The −35 and −10 (Pribnow box) elements are shaded yellow, the extended −10 (Keilty and Rosenberg, 1987) and discriminator (Feklistov et al., 2006; Haugen et al., 2006) elements purple. The nt-strand DNA (top strand) is colored dark grey; the t-strand DNA (bottom strand), light grey. (Right) Electron density and model for nucleic acids. Blue mesh, 2FoFc maps for nucleic acids (contoured at 0.7σ).
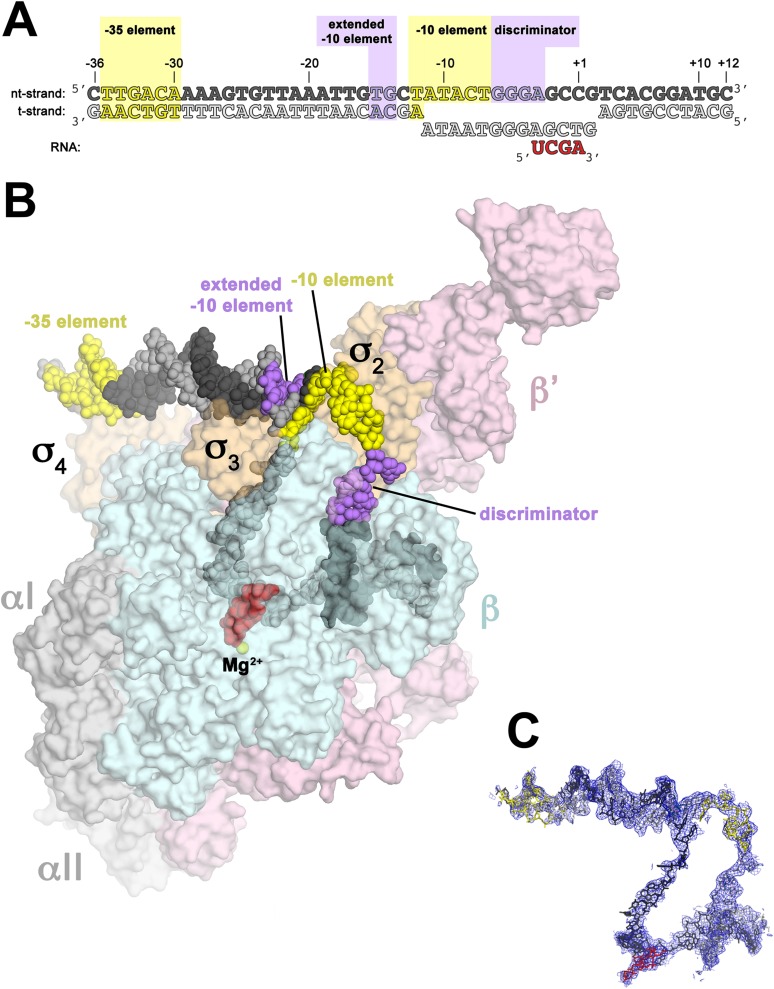
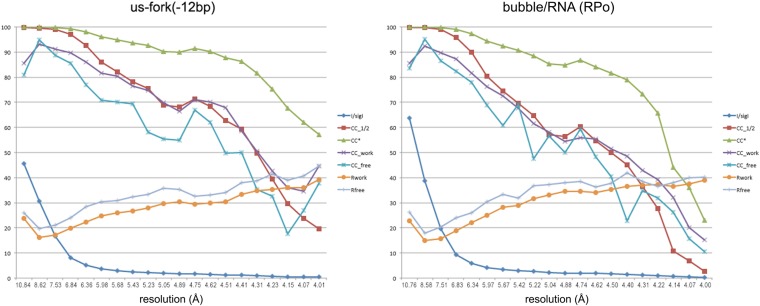
Figure 1—figure supplement 2. Data and model quality for us-fork (−12 bp) and RPo complexes.

Figure 1—figure supplement 2.

Plots relating data quality with model quality at 4.0 Å-resolution) using the Pearson correlation coefficient (CC) analysis described by Karplus and Diederichs (2012). CC1/2 (red squares) was determined from the unmerged diffraction data randomly divided in half. Since CC1/2 underestimates the information content of the data (since it's calculated by dividing the dataset in half), CC* was calculated from an analytical relation to estimate the information content of the full data (Karplus and Diederichs, 2012). CC* provides a statistic that assesses data quality as well and also allows direct comparison of crystallographic model quality and data quality on the same scale through CCwork and CCfree, the standard and cross-validated correlations of the experimental intensities with the intensities calculated from the refined model. A CCwork/CCfree smaller than CC* indicates that the model does not account for all of the signal in the data, meaning it is not overfit. Plotted also are the standard <I>/σI for the diffraction data, as well as the Rwork/Rfree for the refined models. (Left) Data for Taq EΔ1.1σA/us-fork (−12 bp) at 4.0 Å-resolution. (Right) Data for Taq EΔ1.1σA RPo (with 4-nt RNA primer) at 4.0 Å-resolution.

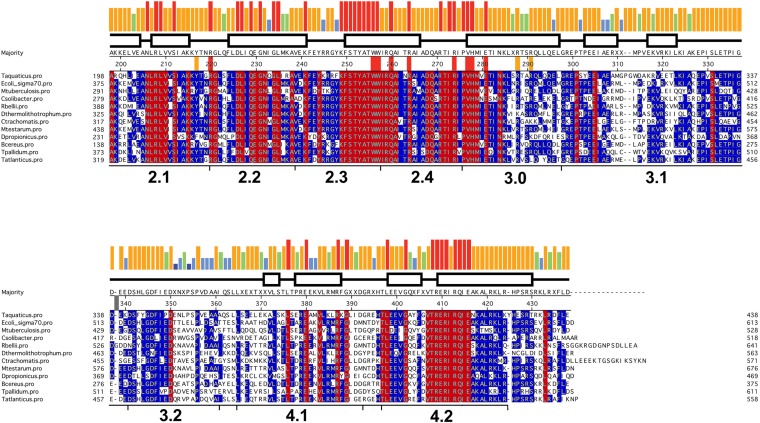
Figure 1—figure supplement 3. Sequence alignment of regions 2–4 of selected bacterial RNAP primary (Group I) σ subunits.

Figure 1—figure supplement 3.

Sequence alignment of regions 2–4 (Lonetto et al., 1992) of bacterial RNAP primary (Group I) σ subunits. The sequences shown were selected from diverse phyla/groups taken from a much larger alignment of 1002 sequences. The σA sequences shown are from the following organisms chosen to represent the preceding phylum/group: Deinococcus-Thermus, Thermus aquaticus; γ-Proteobacteria, Escherichia coli; Actinobacteria, Mycobacterium tuberculosis; Acidobacteria-Candidatus Solibacter usitatus; α-Proteobacteria, Rickettsia belli; Aquificae, Desulfurobacterium thermolithotrophum; Chlamydae, Chlamydae trachomatis; Cyanobacteria, Mastigocoleus testarum; δ-Proteobacteria; Desulfobulbus propionicus; Firmicutes, Bacillus cereus; Spirochaetes, Treponema pallidum; Thermodesulfobacteria, Thermodesulfatator atlanticus. The sequences are shaded according to conservation within the sub-alignment; red shading indicates 100% identity, blue shading indicates >50% identity. The histogram at the top represents the sequence conservation within the entire 1002 sequence alignment (red bar, 100% identity; orange, 83–99%; green, 68–83%; blue, 50–67%).