. 2015 Sep 8;4:e08504. doi: 10.7554/eLife.08504

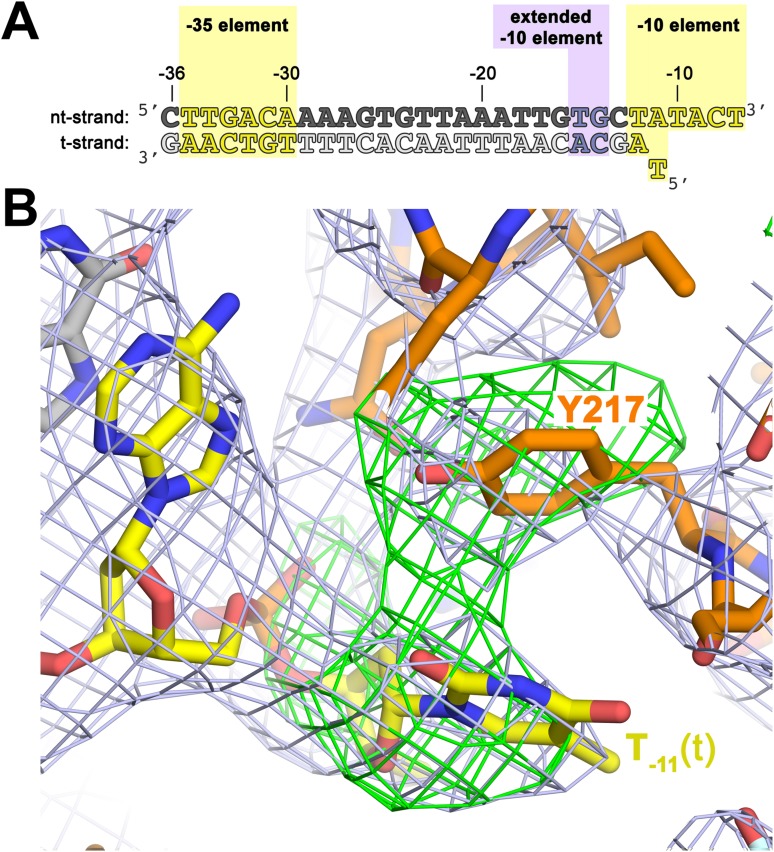
Figure 4. The σA Y217 may stack on the T−11(t) base orphaned by the flipped out A−11(nt) base.

(A) Synthetic oligonucleotides used for us-fork (−11 bp) crystallization. The numbers above the sequence denote the DNA position with respect to the transcription start site (+1). The DNA sequence is derived from the full con promoter (Gaal et al., 2001). The −35 and −10 (Pribnow box) elements are shaded yellow, the extended −10 element (Keilty and Rosenberg, 1987) purple. The nt-strand DNA (top strand) is colored dark grey; the t-strand DNA (bottom strand), light grey; the RNA transcript, red. (B) The T−11(t) base orphaned by the flipped out A−11(nt) stacks on σA Y217 in the us-fork (−11 bp) structure. The 4.6 Å-resolution electron density map (contoured at 0.7σ) is shown (grey mesh). Also superimposed is the simulated annealing omit map (green mesh, FoFc, contoured at 3σ), calculated from a model where σA Y217 was mutated to Ala and the T−11(t) nucleotide was deleted.

DOI: http://dx.doi.org/10.7554/eLife.08504.013

Figure 4.

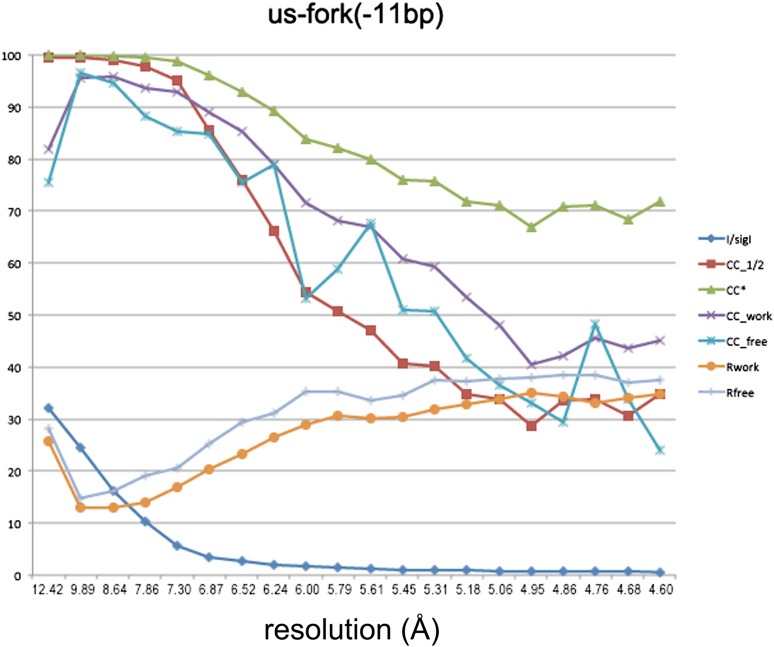
Figure 4—figure supplement 1. Data and model quality for us-fork (−11 bp) complex.

Figure 4—figure supplement 1.

Plots relating data quality with model quality at 4.6 Å-resolution) using the Pearson correlation coefficient (CC) analysis described by Karplus and Diederichs (2012). CC1/2 (red squares) was determined from the unmerged diffraction data randomly divided in half. Since CC1/2 underestimates the information content of the data (since it's calculated by dividing the dataset in half), CC* was calculated from an analytical relation to estimate the information content of the full data (Karplus and Diederichs, 2012). CC* provides a statistic that assesses data quality as well and also allows direct comparison of crystallographic model quality and data quality on the same scale through CCwork and CCfree, the standard and cross-validated correlations of the experimental intensities with the intensities calculated from the refined model. A CCwork/CCfree smaller than CC* indicates that the model does not account for all of the signal in the data, meaning it is not overfit. Plotted also are the standard <I>/σI for the diffraction data, as well as the Rwork/Rfree for the refined models.