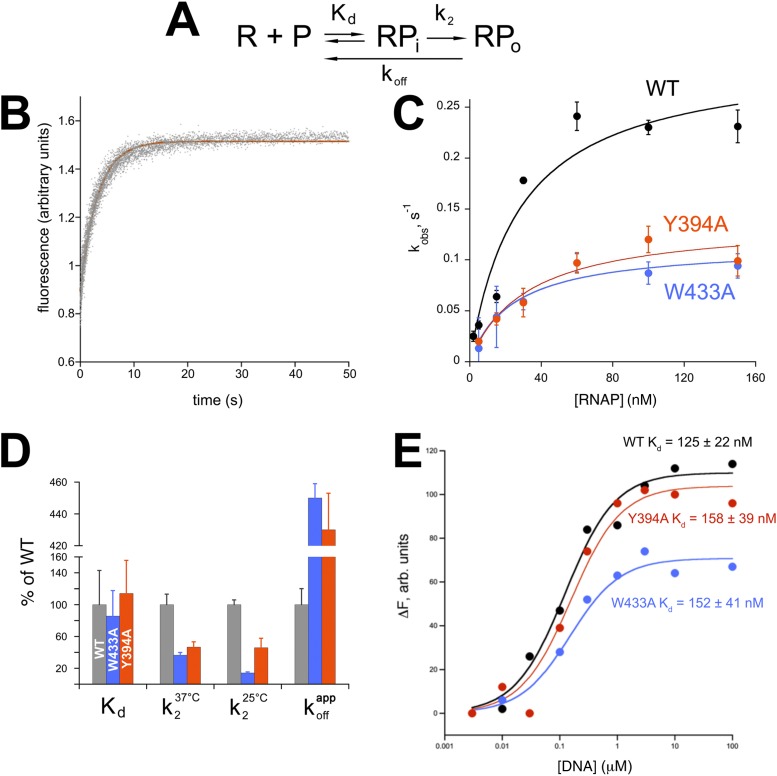
Figure 5. Functional role of Eco σ70 W433 and Y394 in RPo formation.
(A) Simplified, two-step kinetic scheme for RPo formation (Roe et al., 1984; Buc and McClure, 1985) (R, RNAP; P, promoter; RPi, intermediate complex). (B) Representative time trace of fluorescence increase (from Cy3 labelled promoter DNA) during RPo formation. The solid red line illustrates the non-linear regression fit to a single-exponential model (see ‘Materials and methods’), which described >90% of the fluorescence amplitude rise. (C) The RNAP-concentration dependence of the observed rate (kobs) of RPo formation detected by Cy3 fluorescence (Ko and Heyduk, 2014) for Eco holoenzymes with σ70 (wt) as well as σ70 carrying substitutions W433A or Y394A. Error bars denote standard errors of the mean for ≥three independent measurements. (D) Summary of effects of σ70 W433A and Y394A substitutions on thermodynamic and kinetic parameters of RPo formation. The data was normalized to the % observed with wild-type Eσ70. (E) Equilibrium binding of ss nt-strand oligos of λ PR promoter −10 element detected in the fluorescent RNAP beacon assay (Feklistov and Darst, 2011; Mekler et al., 2011) to Eco holoenzymes with σ70, as well as σ70 carrying substitutions W433A or Y394A.


