
Fig. 2.
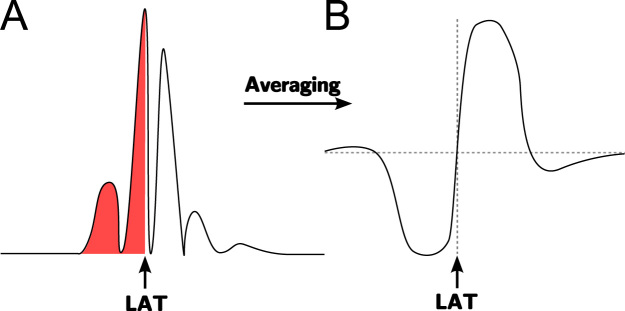
Diagram of morphological approaches. (A) Activation time defined as the point in the complex which equally divides the area under the modulus of the signal. (B) Using an averaging filter on the absolute value of the electrogram to identify the barycentre as the positive zero-crossing point as indicated.