
Figure 3. Models of Ptch-mediated Smo Regulation.
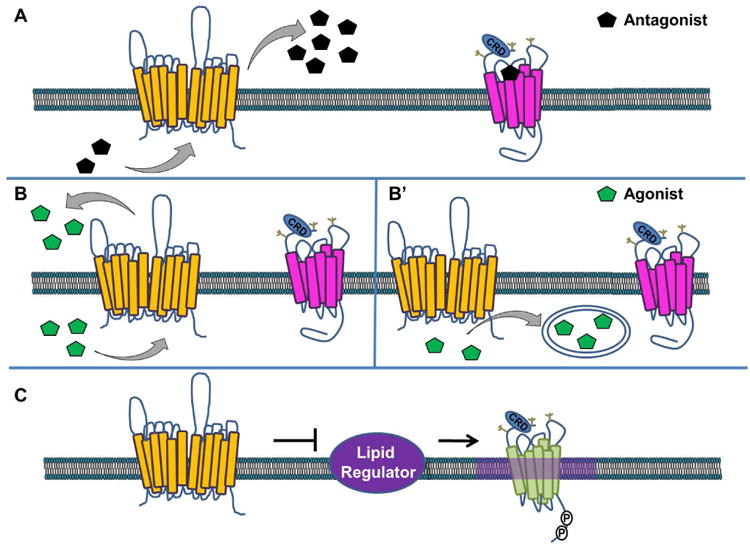
Several models for Ptch-mediated Smo regulation have been hypothesized. In A, Ptch (yellow) pumps an antagonist (black), which binds to cell-surface localized Smo to block its accumulation and signaling (magenta, inactive Smo). In B, Ptch pumps a Smo agonist (green) out of the cell (B) or sequesters it in vesicles (B′) where it is unable to bind and activate Smo. In C, Ptch controls activity of a lipid regulator to block accumulation of a specific lipid species in membrane microdomains that are permissive for Smo signaling (purple haze, active Smo shown in green).