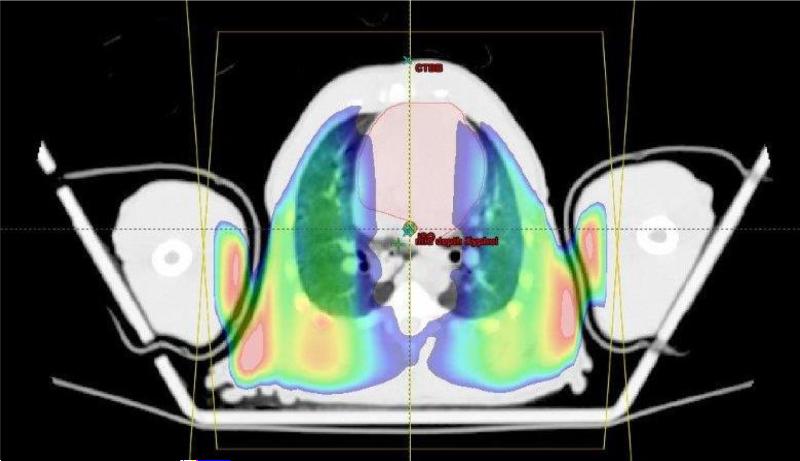
Fig. 7.
Dose gradient within the heart and lungs at the level of the sternum shown in an axial view for one NHP. Dose levels are displayed in a color-wash. Doses demonstrated range from 1070 cGy (blue) to 1170 cGy (orange). Note the dose deficit in the heart caused by the increased attenuation by the bones of the sternum and spine, and the increased dose to tissues underlying the less dense lung.

