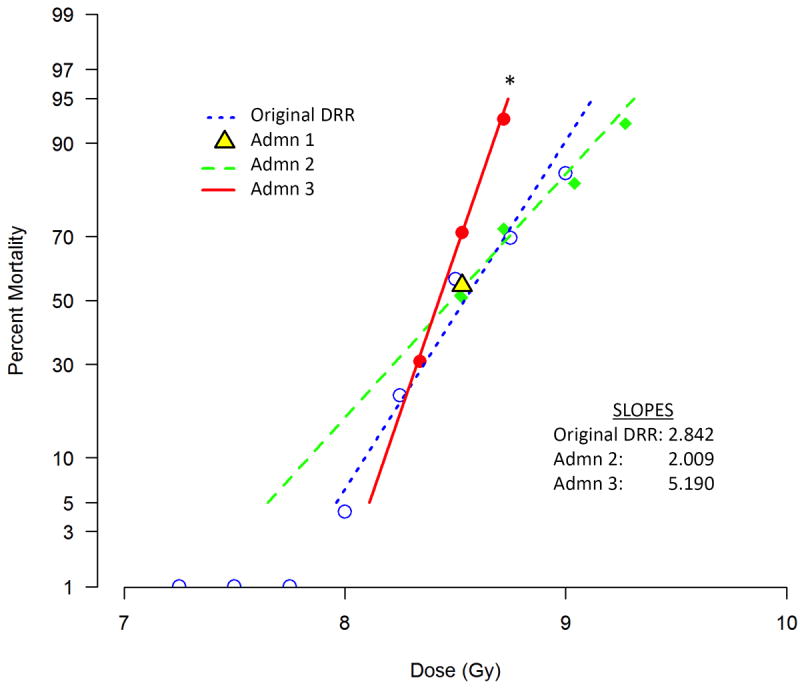
Figure 1. Probit plots.

Vehicle-treated control groups from 20 individual survival efficacy studies were divided into 3 groups based on the severity of the administration (Admn) schedule of their MCM: Admn 1 (n=5 studies, 274 total mice) underwent no injections, Admn 2 (n=11 studies, 444 total mice) underwent 1-3 SQ or IM injections, and Admn 3 (n=4 studies, 199 total mice) underwent 29 consecutive daily SQ injections or 6 to 9 every other day oral gavages. Thirty-day mortality of mice in each group at different radiation doses was used to construct the probit plots, with percent mortality on the y-axis and radiation dose on the x-axis. Admn 1 mice were exposed to only one radiation dose (LD50/30), thus a probit could not be constructed. Admn 2 mice were exposed to the LD50/30, LD70/30, LD90/30, and LD95/30. Admn 3 mice were exposed to the LD30/30, LD50/30, and LD70/30. All LDXX/30 values were derived from the original DRR probit shown on the figure, generated using 164 mice randomized into 10 radiation dose groups. The slopes of each probit are given on the figure; the slope of Admn 3 was significantly steeper than that of Admn 2 or the original DRR.
