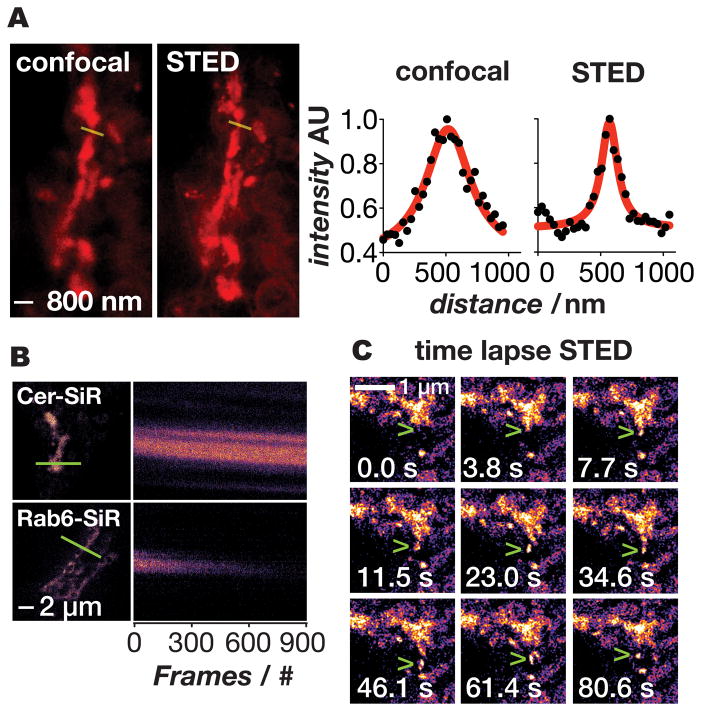
Figure 6.
Super-resolution imaging of the Golgi in live cells using Cer-SiR. a) Confocal and STED images of the Golgi in live cells treated with Cer-TCO and SiR-Tz. Line traces through the Golgi (yellow) show the greatly improved resolving power of STED (right panel). b) Kymographs (line profile vs. time) of fixed cells imaged by STED in which the Golgi was labeled with Cer-SiR or SiR-SNAP-Rab6 (Rab6 is a Golgi targeted protein); note that the signal decays much more quickly when the protein is labeled with SiR. c) Time lapse STED of vesicle budding and trafficking out of the Golgi (green arrowhead).

