Figure 2.

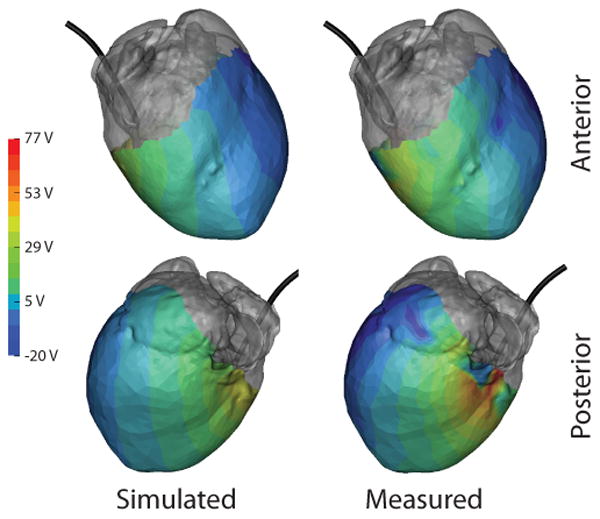
Comparison of measured and simulated potentials on the cardiac surface as observed during test 2. Gray regions indicate areas not covered by the cardiac sock. ICD coil (black) is included from reference.

Comparison of measured and simulated potentials on the cardiac surface as observed during test 2. Gray regions indicate areas not covered by the cardiac sock. ICD coil (black) is included from reference.