Figure 1.
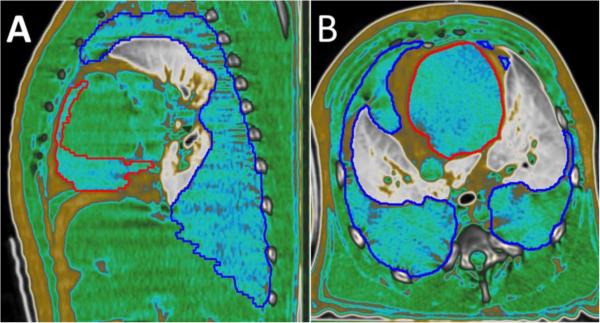
CT image of NHP lung. Sagittal (A) and transverse (B) images from the same animal demonstrating the MIM® software HU Fat-Water-Tissue viewing window.
The red outline represents pericardial effusion and the dark blue outline representing pleural effusion. Both outlines surround areas of characteristic blue fluid. Yellow/gold appears around the outer edges representing subcutaneous fat and in between the red and blue lines in the center representing fat around the pericardium. Cardiac and back muscle tissue is shown in green. Lung tissue is displayed on a gray scale.

