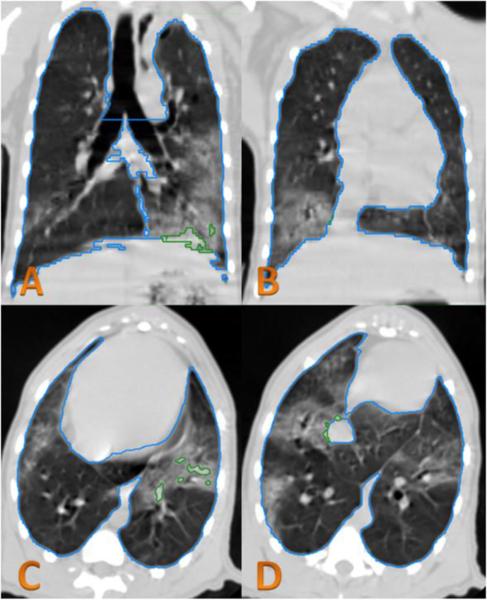
Figure 2.
CT analysis of irradiated NHP.
In the CT images obtained at 179 DPI, lung injury can be seen in the left lower lobe (image A,C) and the lower right lobe (image B,D). The green contour lines in the left lower lobe demonstrate lung injury that is excluded from the NLV using the conventional HU range of −880 to −200. This shows that not all of the visualized CT changes of lung injury were excluded from the NLV. The blue contour line is considered total lung volume.

