
Fig. 5.
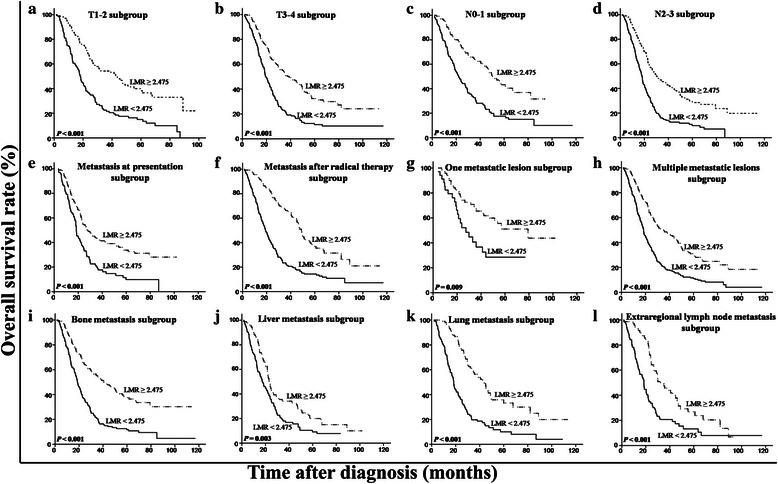
Kaplan-Meier OS analysis according to baseline LMR in patients with metastatic NPC. In the T1-2 subgroup (a), the T3-4 subgroup (b), the N0-1 subgroup (c), the N2-3 subgroup (d), the subgroup with metastasis at presentation (e), the subgroup with metastasis after radical therapy (f), the subgroup with one metastasis lesion (g), the subgroup with multiple metastasis lesions (h), the bone metastasis subgroup (i), the liver metastasis subgroup (j), the lung metastasis subgroup (k), and the extraregional lymph node metastasis subgroup (l), the OS rates are higher in the patients with a high LMR than in those with a low LMR (all P < 0.01)