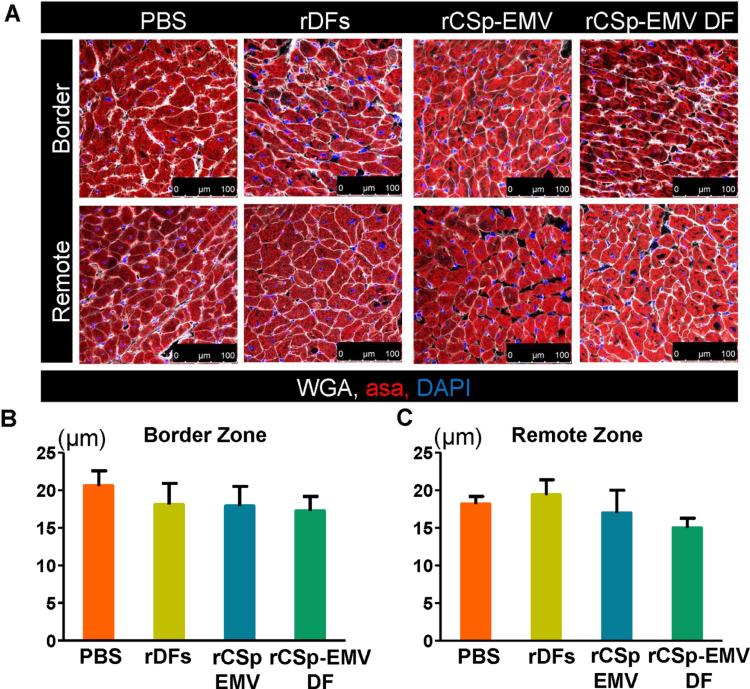
FIGURE 7. In Vivo Cardiomyocyte Architecture 1-month Post-therapy.
(A) Representative immunostained images from the border and remote zones were used for evaluation of cardiomyocyte diameter. Pooled data revealed no difference between the groups analyzed in the border (B) and remote (C) zones. n = 5 in each of the groups. Scale bar = 100 μm. ASA =α- sarcomeric actin; other abbreviations as in Figures 1 and 5.

