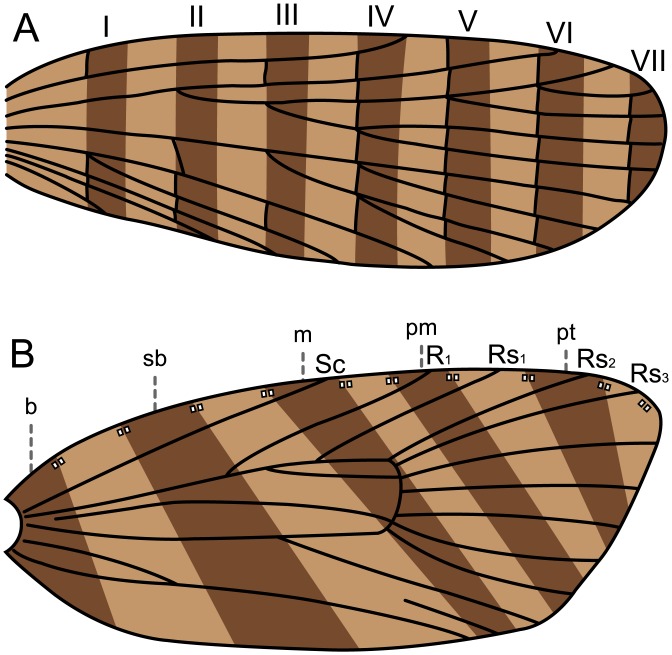
Fig 1. The two predictive models that relate wing pattern to wing venation.
The beige areas of the wing represent the lighter, interfascial areas; the dark brown areas represent the fasciae. (A) The “vein-fork” model and associated nomenclature for fasciae (I-VII) shown on a panorpoid wing, following Lemche [14]. (B) The “wing-margin” model and associated nomenclature, following Baixeras [28]. Legend: b: basal; sb: subbasal; m: median; pm: postmedian; pt: preterminal.

