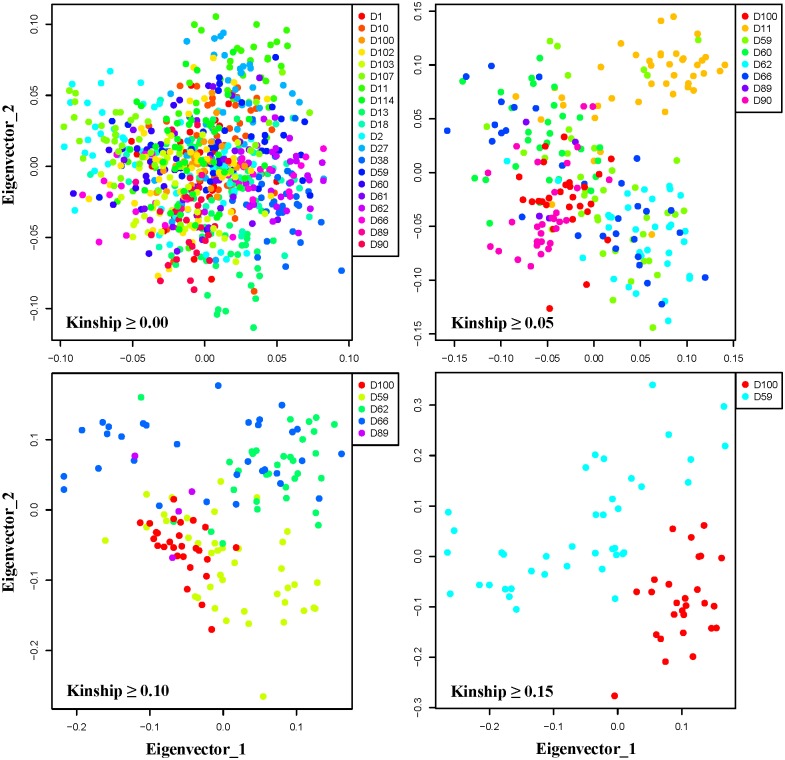
Fig 2. Scatter plots for four subsets with different kinship coefficient criteria (X-axis: Eigen vector 1 and Y-axis: Eigen vector 2).
Scatter plots were generated by PCA using GCTA [24]. Each point represents an individual animal and is colored based on the farm information. When the kinship cutoff increased, each farm was more clearly distinguishable.

