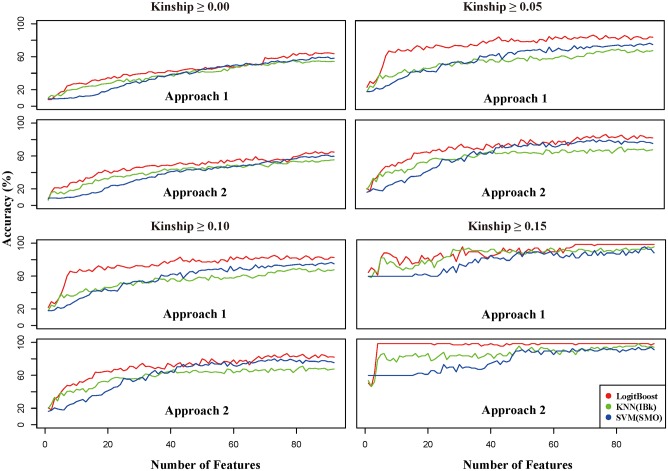
Fig 3. Line plots for comparing classification accuracy according to several factors, including classifiers, feature subsets, and kinship-based filtered subsets.
The X-axis contains the number of features (1 to 92 SNPs), while the Y-axis shows classification accuracy. Approach 1 is the top-down feature selection method while Approach 2 is the bottom-up feature selection technique. LogitBoost-based classification accuracy is represented by the red line. Lines corresponding to the KNN and SVM classification methods are green and blue, respectively.

