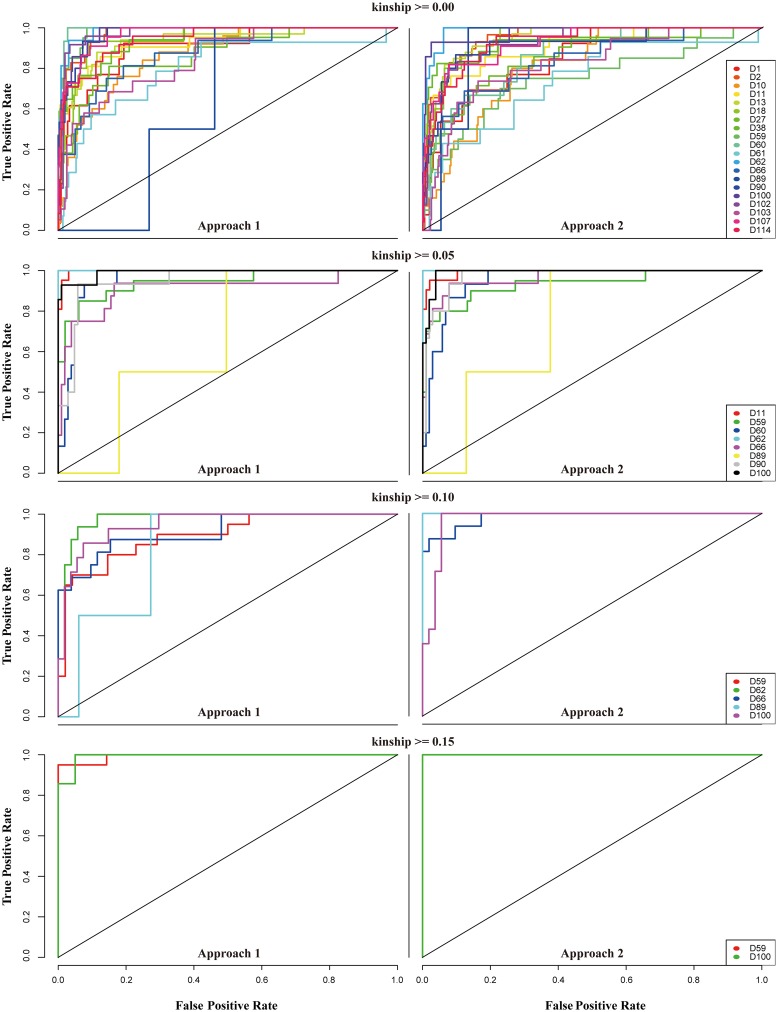
Fig 4. ROC curves for different kinship-based subsets to evaluate the suitability of specific farm groups with the LogitBoost classifier.
To calculate sensitivity and specificity, data were divided in half and used as a training and test set. Threshold-specific performance could then be monitored using continuous cutoffs based on the ROC curves. All processes were conducted for the four subsets with two approaches. The D89 class showed the lowest performance in most cases.

