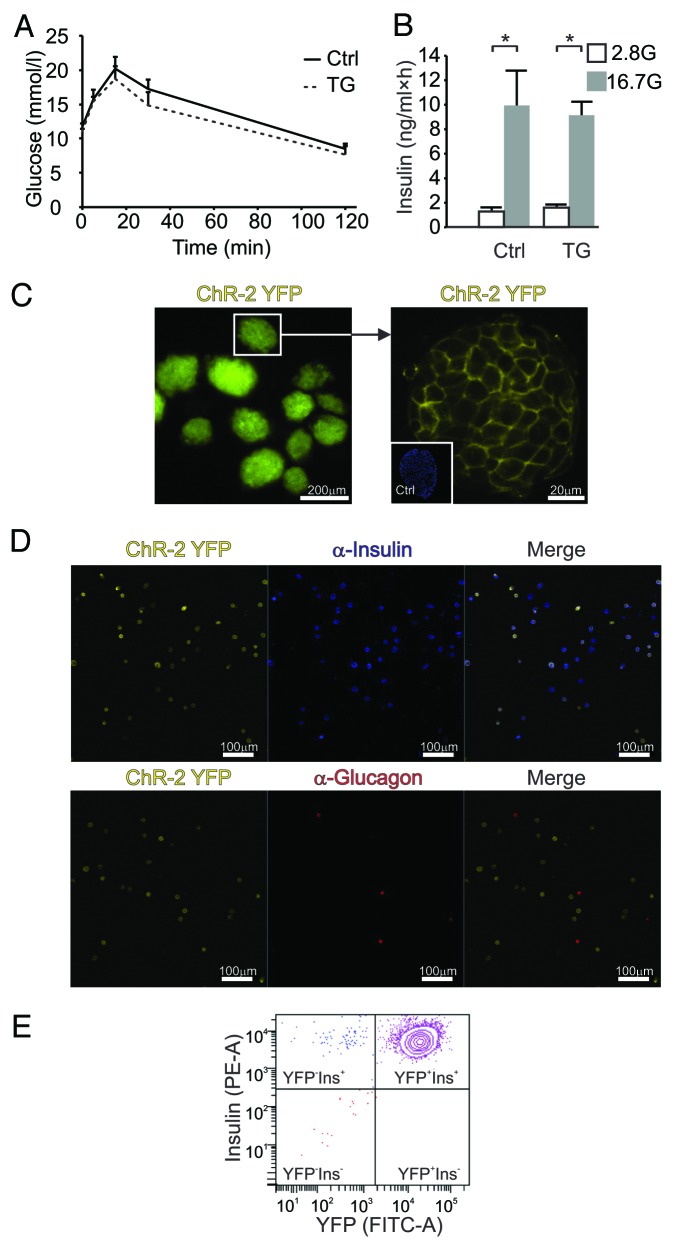
Figure 1. (A) IPGTTs of transgenic (TG, dotted trace; n = 7) and control mice (Ctrl, continuous trace; n = 8) show no significant difference. (B) Insulin secretion from batches of TG or control islets in response to 1 h incubations at 2.8 mmol/L (empty bars; n = 3 experiments) or 16.7 mmol/L glucose (gray bars; n = 3). (C) ChR2-YFP fluorescence in TG islets. Right panel shows an islet at higher magnification and a non-TG (Ctrl) islet stained with DAPI (inset). (D) Representative examples of ChR2-YFP fluorescence in dispersed islets cells stained for insulin (upper panel) or glucagon (lower panel). Merged images are shown to the right. Scale bar is 100 μm. Data are means ± SEM *P < 0.05. (E) Contour plot of fluorescent cell counting using FACS (representative example of β-cell fraction from one animal) with the PE-A signal representing insulin-positive (Ins+) and the FITC-A signal denoting YFP-positive cells (YFP+), all in the β-cell gate.

An official website of the United States government
Here's how you know
Official websites use .gov
A
.gov website belongs to an official
government organization in the United States.
Secure .gov websites use HTTPS
A lock (
) or https:// means you've safely
connected to the .gov website. Share sensitive
information only on official, secure websites.
