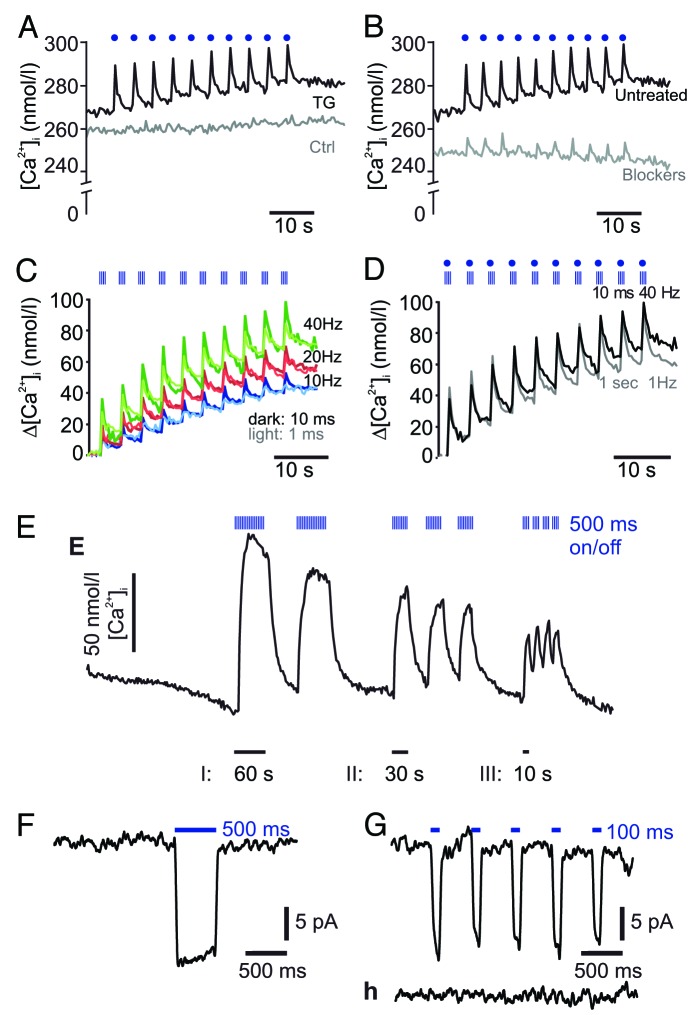
Figure 2. (A) Effect of blue LED light illumination on [Ca2+]i in ChR2-expressing transgenic TG islets (n = 11) or ChR-2 negative control islets (control; n = 7) (representative traces shown). Here, each light pulse is 100 ms long (depicted as blue dots, not to scale) and glucose concentration was 2.8 mmol/l. Ten images were acquired in between light pulses. (B) As in (A) but traces show recordings after 15 min pre-incubation with 5 µmol/l isradipine and 100 nmol/l SNX-482 (gray trace; n = 10) compared with untreated TG islets (black trace; n = 11, same trace as in [A]). (C) Changes in [Ca2+]i in response to different light protocols (for details see also Fig. S1). Each blue striped box corresponds to a 1 s stimulation segment during which ten 1 ms (light-colored traces) or ten 10 ms long (dark-colored traces) light pulses were fired at different frequencies: 10 Hz (blue traces; n = 3/8 experiments using 1 ms/10 ms pulses, respectively), 20 Hz (red traces; n = 4/4) or 40 Hz (green traces; n = 4/3). Ten images were acquired in between the 1 s long stimulation segments. (D) As in (c) but using continuous light for 1 s (n = 4) compared with pulsatile stimulation at 40 Hz and 10 ms pulse duration (n = 3). (E) Effect of longer pulsatile illumination on [Ca2+]i. Each thin blue stripe of the stimulation segment corresponds to a 500 ms light pulse with stimulation segment duration as despicted (I: 60, II: 30, and III: 10 s respectively). Images were acquired in between the single light pulses and between the stimulation segments. Representative examples of illumination-evoked currents with 500 ms (F) and 100 ms blue light pulses in single transgenic β-cells. (H) As in (G) but in ChR2-negative control islet cells.

An official website of the United States government
Here's how you know
Official websites use .gov
A
.gov website belongs to an official
government organization in the United States.
Secure .gov websites use HTTPS
A lock (
) or https:// means you've safely
connected to the .gov website. Share sensitive
information only on official, secure websites.
