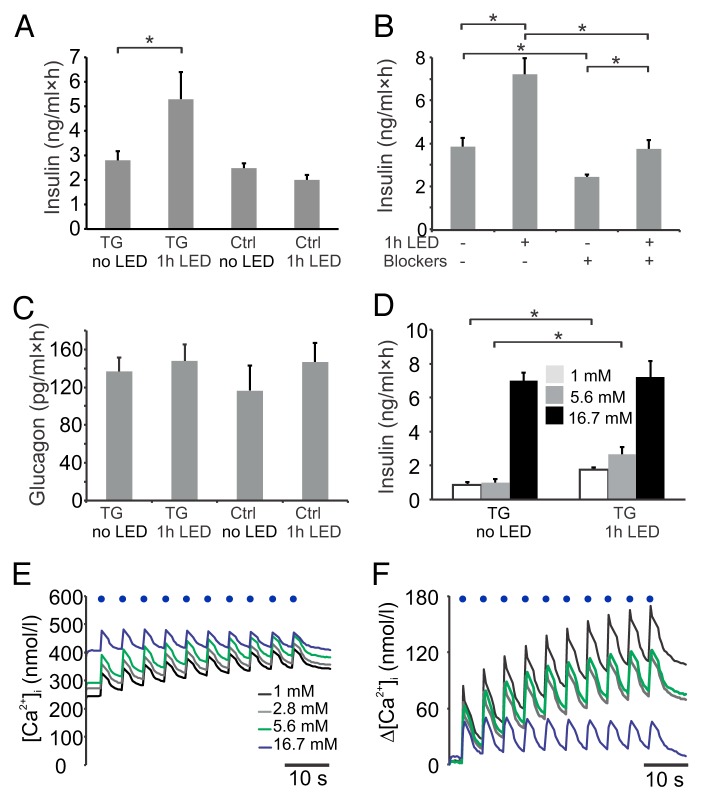
Figure 3. (A) Insulin release in response to 1 h constant blue LED light stimulation (LED) in batch-incubated TG islets (n = 4 replicates) or non-ChR2 expressing control islets (n = 4) at 2.8 mmol/l glucose. (B) Insulin secretion from TG islets at 2.8 mmol/l glucose with or without 1 h constant light stimulation and in the presence or absence of 5 µmol/l isradipine and 100 nmol/l SNX-482 (n = 8). (C) Effect of light stimulation on glucagon release in TG (n = 6) and control islets (n = 6) at 2.8 mmol/l glucose. (D) Insulin secretion with or without 1 h light stimulation at 1 mmol/l (empty bars), 5.6 mmol/l (gray bars) and 16.7 mmol/l glucose (black; n = 7 for all). (E) Effect of different glucose concentrations on basal and light-induced [Ca2+]i concentrations subsequently recorded from the same islets with 5 min incubations in the respective concentration (black continuous trace 1 mmol/l; gray trace 2.8 mmol/l; 5.6 mmol/l in green and 16.7 mmol/l in blue; n = 5 experiments). (F) Same as in (E), but data depicted as changes in [Ca2+]i (Δ[Ca2+]i) to facilitate comparison of the peaks. Data in bar charts are means ± SEM *P < 0.05.

An official website of the United States government
Here's how you know
Official websites use .gov
A
.gov website belongs to an official
government organization in the United States.
Secure .gov websites use HTTPS
A lock (
) or https:// means you've safely
connected to the .gov website. Share sensitive
information only on official, secure websites.
