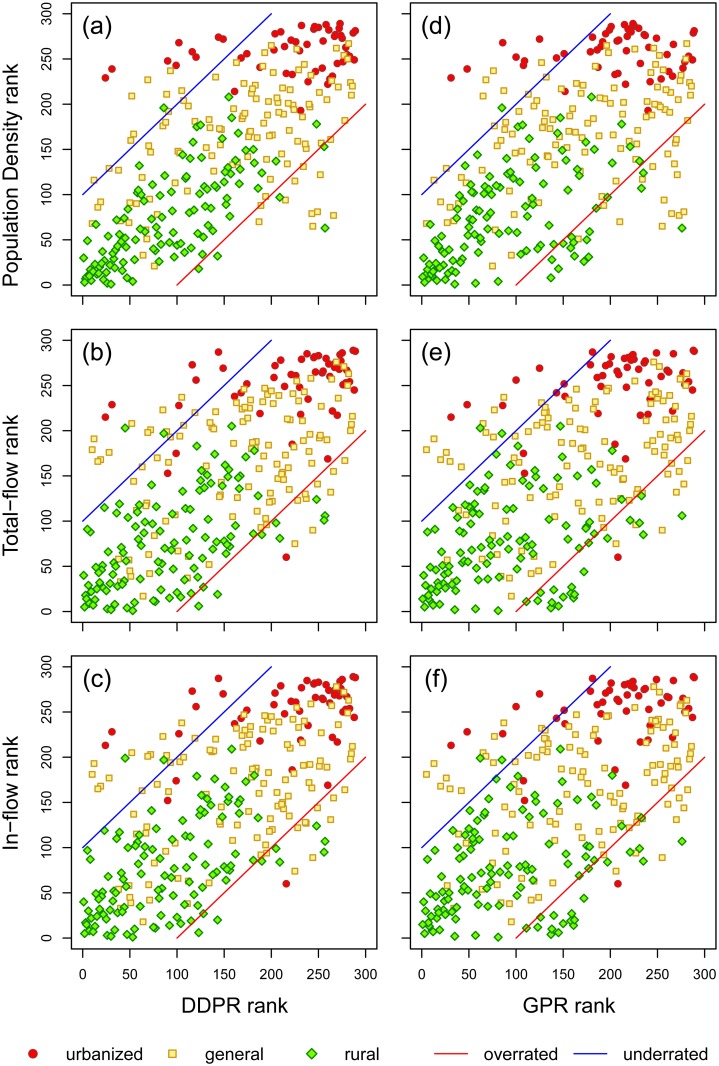
Fig 5. Association between DDPR (a-c) and GPR (d-f) ranks with human movement concentration ranks.
(a) DDPR: population density; (b) DDPR: in-flow density; (c) DDPR: total flow density; (d) GPR: population density; (e) GPR: in-flow density; (f) GPR: total flow density. Most urban areas are clustered in the upper-right area of each plot in the figure, indicating that they are rated as having high DDPR and GPR rankings and as areas with high-concentration of human movement. On the other hand, most rural area nodes are clustered in the bottom-left areas of the plots, indicating that such areas are rated as having low DDPR and GPR rankings and as areas with low-concentration of human movement. Most nodes in the upper-left area of the plot are urbanized areas, which suggests that the ranks of high-level urbanized areas could be underrated by the DDPR and GPR scores.

