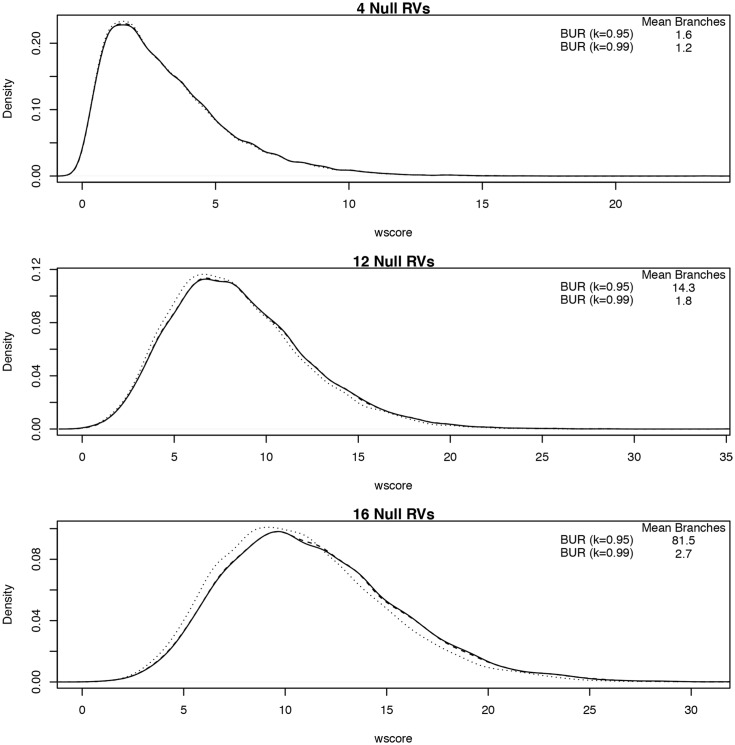
Fig 2. Density plot of model selection and BUR model-averaging approach test statistics under the null situation where all RVs are non-causal given a RV-set size of 4 (top), 16 (middle), or 28 (bottom).
The x-axis is the value of the test statistic and the y-axis is the density of the distribution. Plotted in each figure are Seq-aSum-VS, BUR (κ = 0.95), and BUR (κ = 0.99) as solid, dotted, and dashed lines, respectively. The number of branches averaged over by these model-averaging approaches is in the upper right table of each plot.

