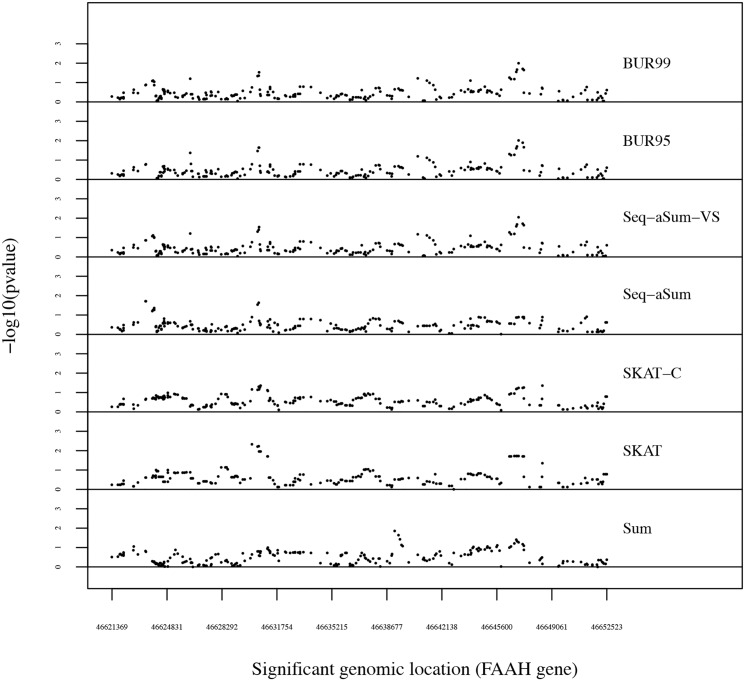
Fig 3. A sliding window analysis of FAAH gene for each method from top to bottom: BUR with κ = 0.95 (BUR95), BUR with κ = 0.99 (BUR99), Seq-aSum-VS, and Seq-aSum, SKAT-C, SKAT, and Sum.
A window size of 1000 bp is used. The −log10(p-value) for each window is plotted on the y-axis. The beginning genomic location of each window is plotted across the x-axis. Each point represents the −log10(p-value) of one window.

