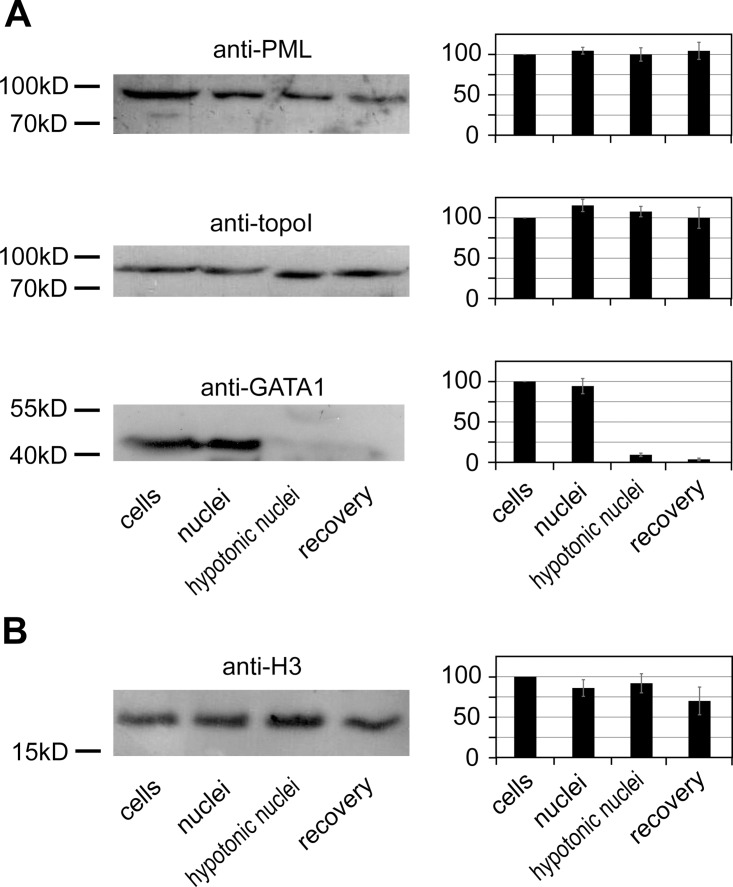
Fig 1. Retention of PML, DNA topoisomerase I, GATA–1, and histone H3 in nuclei after cell lysis and subsequent treatments (Western blot analysis).
Representative images of Western blots are shown at the left part of the Figure, and the results of the analysis at the right part of the Figure. The positions of size markers are indicated to the left of the blots. The intensities of bands were determined using ImageJ software. In experiments shown in (A) the determined intensities of each band were normalized to the intensity of the histone H3 band in the same sample (section B). Diagrams show the average results of three independent experiments. The amount of protein in non-lysed cells was considered as 100%. The error bars represent SEM.

