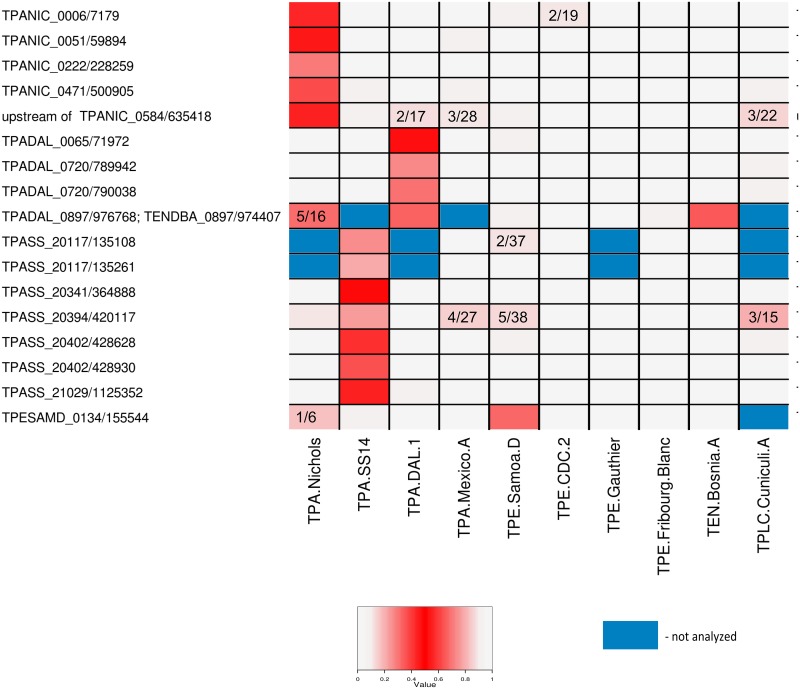
Fig 2. A schematic representation of the identified heterogeneous positions in all investigated genomes.
The proportion of alternative alleles is based on nucleotide frequency within individual Illumina reads. While red cells represent identified sites of intrastrain heterogeneity, grey cells represent sites of intrastrain homogeneity. The numbers within cells indicate the number of alternative/standard reads in the sites where the number of alternative reads exceeded 10% but were lower than 20% and therefore remained below the threshold used in this study. Blue cells show nucleotide positions omitted from analysis due to excluded paralogous sequences (S2 Table). For the Bosnia A strain, the intrastrain heterogeneous sites TENDBA_0314/331578, TENDBA_0314/331618, TENDBA_0317/333355 and TENDBA_0621/672156 are not shown because in all other genomes these positions were excluded from analysis due to paralogous sequences. Note that the TPADAL_0897/976678 and TENDBA_0897/974407 positions are the same.

