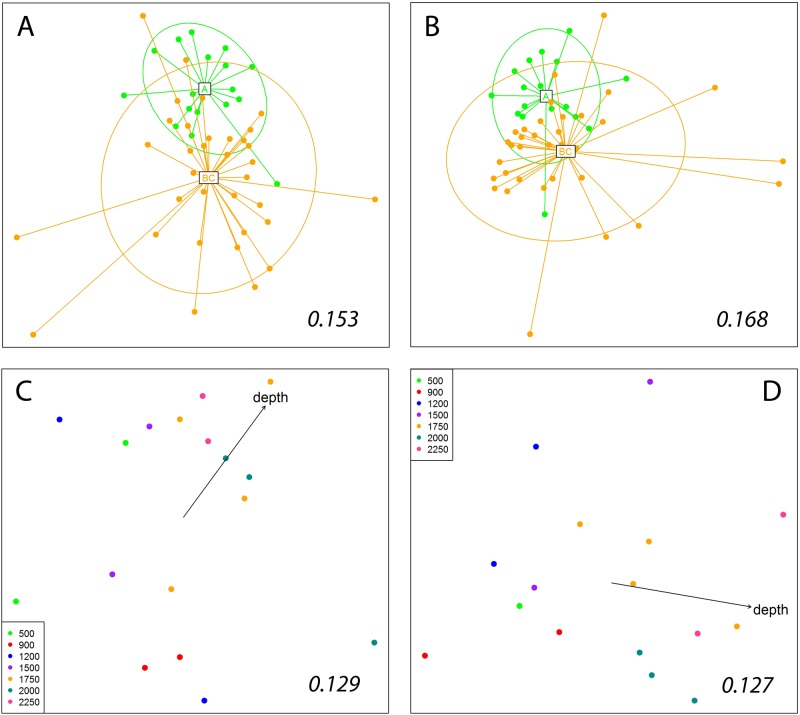
Fig 6. Non-metric Multidimensional Scaling plots of the sediment samples separated by layers (layer A, first cm of sediment in the corer; layer B, second cm; layer C, cm 3–5).
Ordinations are obtained using Jaccard dissimilarity index (A), and Bray-Curtis dissimilarity index (B). The centroids of layer A and layers B+C, and the corresponding inertia ellipses, are indicated. (C) nmMDS plot obtained for layer A alone with the Jaccard index. (D) nmMDS plot obtained for layers B+C with the Jaccard index. Samples in these plots are presented with color-coded depth categories and the fitted gradient vector of depth is added. Numbers inside the plots are the stress values of the retained configurations.

