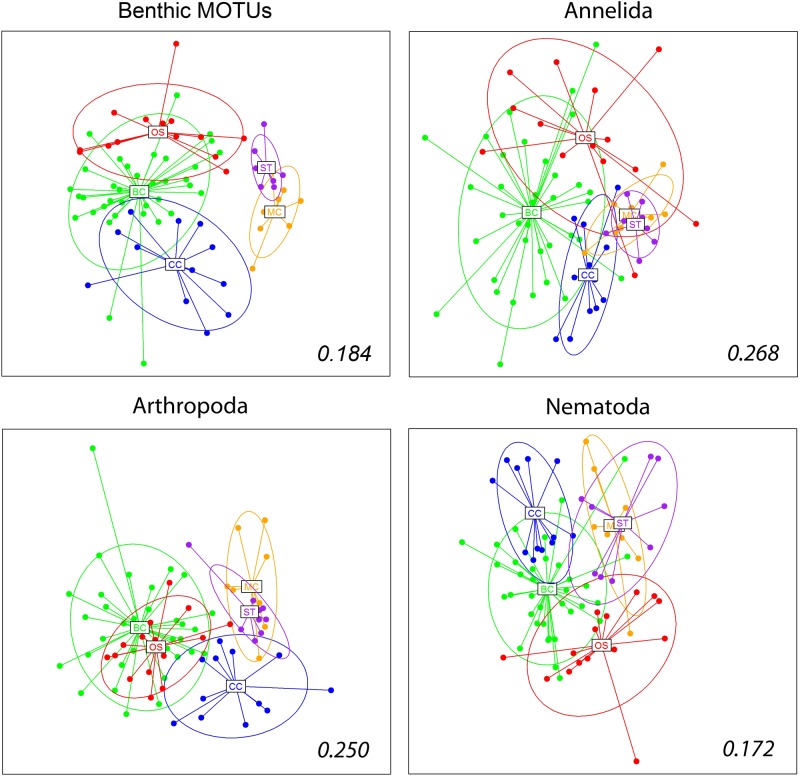
Fig 8. Non-metric Multidimensional Scaling plots of the samples obtained using Jaccard dissimilarity index for the benthic taxa and the main metazoan phyla.
The centroids for the different zones, and the corresponding inertia ellipses, are indicated. Numbers inside the plots are the stress values of the retained configuration.

