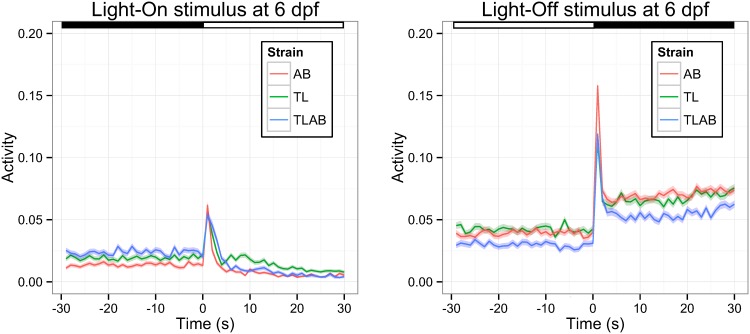
Fig 2. The VMR of 6-dpf WT strains.
The VMR was measured from three WT strains: AB, TL and TLAB as described in the methods. The activity was defined as the fraction of frames in each second that a larva in the video was detected moving (see methods for the detailed definition). Then, the activities from all trials under the same light stimulus were averaged and plotted. The results for Light-On and Light-Off VMR are shown in the left and right figures respectively. These figures show the mean activity of AB (red trace), TL (green trace) and TLAB (blue trace) from 30 s before the light change to 30 s after the light change. The corresponding error in 1 S.D. is shown by the colour ribbon surrounding the mean activity trace. The light and dark periods are indicated by white and black bars at the top of the figures. The sample size was 573 for AB, 528 for TL, and 555 for TLAB respectively. These values are the total observation from the two biological repeats and three technical repeats.

