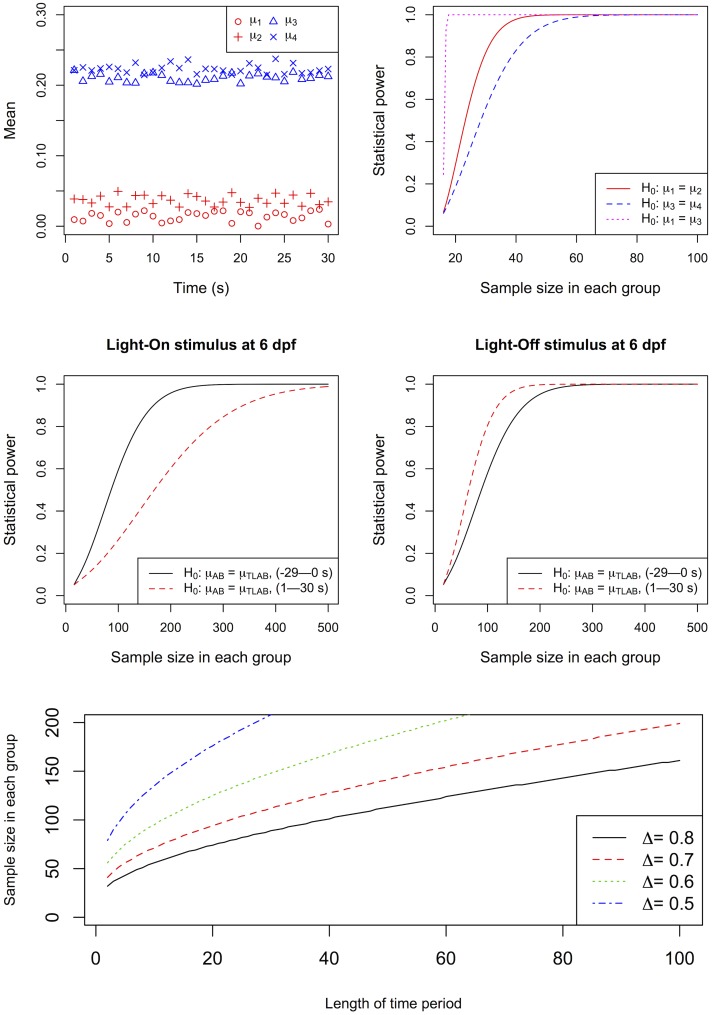
Fig 5. Power analysis.
(Top left) Four hypothetical activity profiles. μ 1 (red circles) and μ 2 (red pluses) are two vectors with very small difference and without any overlap. μ 3 (blue triangles) and μ 4 (blue crosses) are two vectors with very small difference and overlap. (Top right) These vectors were used for power analysis of three comparisons: (1) μ 1 vs. μ 2 (red curve); (2) μ 3 vs. μ 4 (blue dash curve); and (3) μ 1 vs. μ 3 (pink dotted curve). In the plot, the y-axis shows the statistical power, while the x-axis shows the sample size in each group. (Middle left) The power analysis results of two comparisons: (1) μ AB vs. μ TLAB before light change (-29–0 s) of the Light-On stimulus at 6 dpf (black curve); (2) μ AB vs. μ TLAB after light change (1–30 s) of the Light-On stimulus (red dash curve). (Middle right) The power analysis results of two comparisons: (1) μ AB vs. μ TLAB before light change of the Light-Off stimulus (black curve); (2) μ AB vs. μ TLAB after light change of the Light-Off stimulus (red dash curve). In these four comparisons, the y-axis shows the statistical power, while the x-axis shows the sample size in each group. This sample size can be further reduced in real experiments because they often have multiple biological and technical repeats, which can be combined as indicated by our analyses. For example, one sixth of the samples can be used to attain the same theoretical power if an experiment is conducted with 2 biological repeats and 3 technical repeats, a typical VMR design that was used in this study. These sample numbers are shown in the parenthesis in the x-axis. (Bottom) The relationship between the length of time period and sample size under different effect size. In this simulation, the significance level and statistical power is fixed at 0.05 and 0.8 respectively, and the effect size is calculated as Δ = (μ (1) − μ (2))′Σ −1(μ (1) − μ (2)). Four sample effect sizes (0.5, 0.6, 0.7 and 0.8) were used in the simulation for time period ranges from 2 to 100. The results indicate that as the length of time period becomes shorter, fewer samples are needed to attain statistical significance. The sample size can be further proportionally reduced by proper experimental replications.

