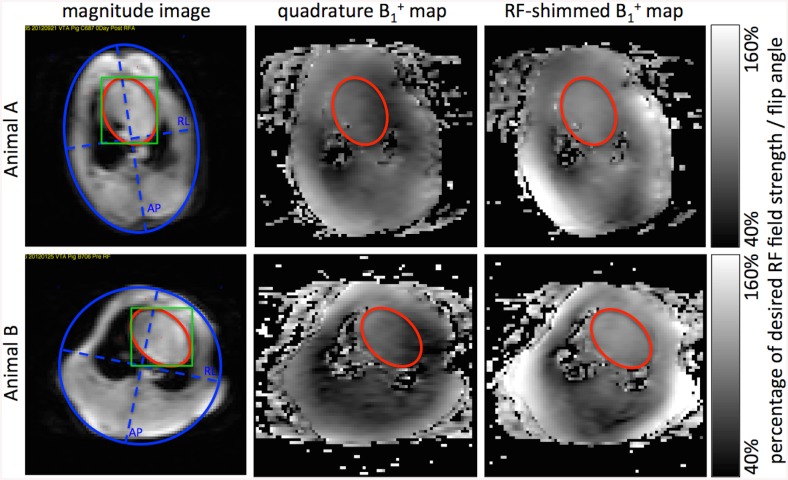
Fig 1. Representative B1 + maps and ROI placement.
Axial magnitude images (1st column) through the center of the heart are used to select the heart (red) and cross sectional body area (blue) elliptical ROIs. The scanner routine was used to calculate RF-shim values localized to a manually drawn rectangle (green). Corresponding B1 + maps acquired in quadrature mode pre-RF shimming and RF-shimmed are shown in the 2nd and 3rd columns, respectively. Data from two different animals A and B are shown in the two rows. Lengths of RL and AP were defined as the dash blue lines for RL/AP ratio calculation.

