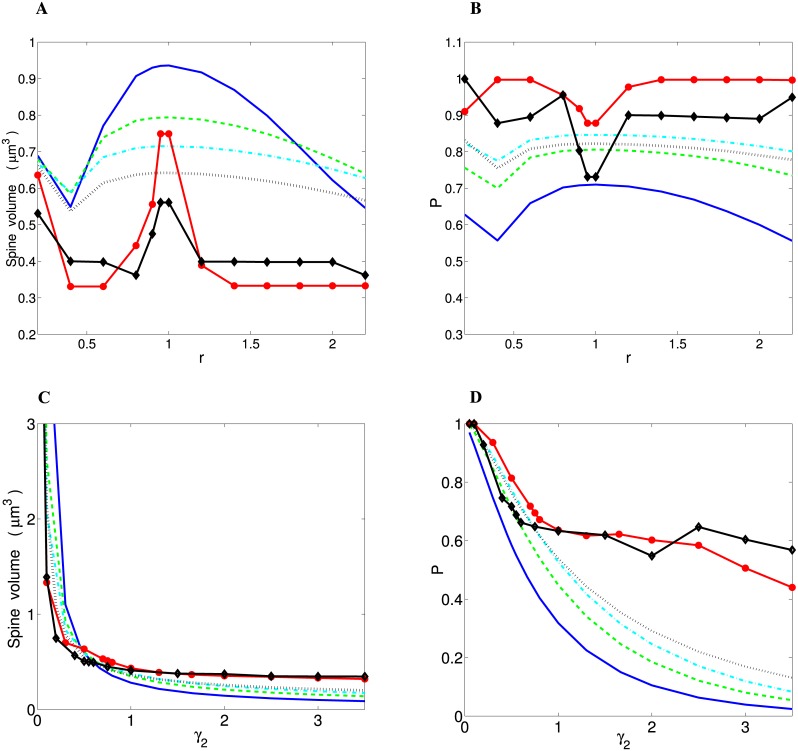
Fig 7. Optimal average spine volume and conditional probability of spine formation P for different distributions of spine sizes.
Panels (A) and (B) refer to “wire volume minimization”, whereas panels (C) and (D) correspond to “spine economical maximization”. (A) Non-monotonic dependence of spine volume and (B) conditional probability P on r for wire fractional volume minimization (γ 1 = 0). (C) Spine volume and (D) conditional probability P decrease monotonically with increasing the exponent γ 2. For all panels the same labels for curves corresponding to a given distribution were used, and they are identical to the labels used in Fig 5A and 5C. The curves for Log-logistic and Log-normal correspond to different values of the parameters, respectively, β and σ that yield the minimal ED for a given r or γ 2. For all panels θ = 0.321 μm3.

