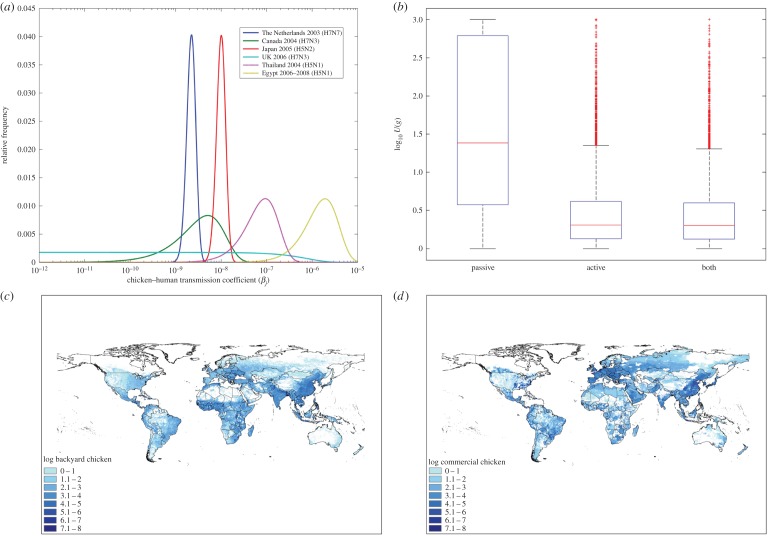
Figure 1.
(a) Probability distributions for (Egypt, Thailand) and (others), (b) under reporting factor distributions for active and combined surveillance systems (both HPAI and LPAI) and passive (HPAI only) (central red line, median; box, approx. 25th/75th percentiles; whiskers, approx. first and 99th percentile), (c,d) global domestic chicken population densities, backyard and commercial production systems, respectively [14].

