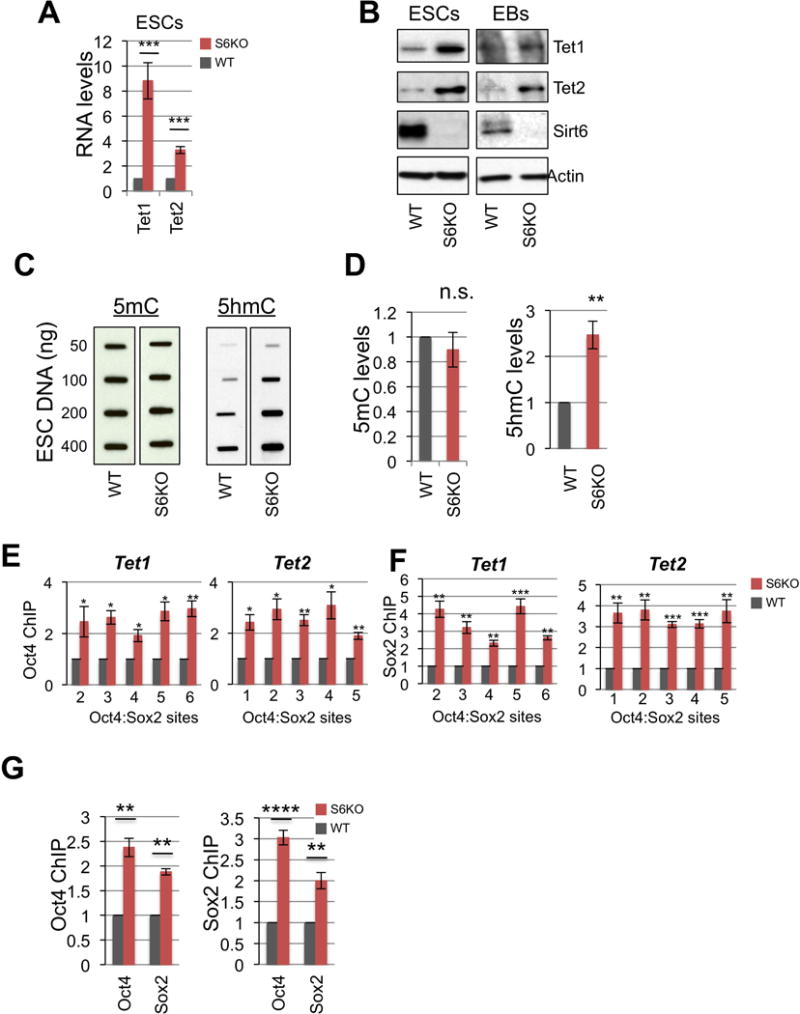
Figure 3. Oct4:Sox2-dependent upregulation of Tets in S6KO versus WT ESCs and EBs.

(A) Tet1 and Tet2 gene expression in WT versus S6KO ESCs. qRT-PCR data is expressed relative to WT ESCs.
(B) Western blot analysis for Tet1 and Tet2 in both ESCs and EBs. A representative of n = 3 biological replicates is shown.
(C) Global 5mC and 5hmC levels assayed by slot blot analysis in WT versus S6KO ESCs.
(D) Graphs showing fold change of 5mC and 5hmC from panel (H).
(E) ChIP analysis for Oct4 on both Tet1 and Tet2 at Oct4:Sox2 predicted binding sites (Koh et al., 2011) in WT versus S6KO ESCs. Data is expressed relative to WT values.
(F) ChIP analysis for Sox2 on both Tet1 and Tet2 at Oct4:Sox2 predicted binding sites (Koh et al., 2011) in WT versus S6KO ESCs. Data is expressed relative to WT values. The data are n = 3 experimental replicates. Values are mean +/− s.e.m. *P < 0.05, **P < 0.01, ***P < 0.001, by t-test analysis.
