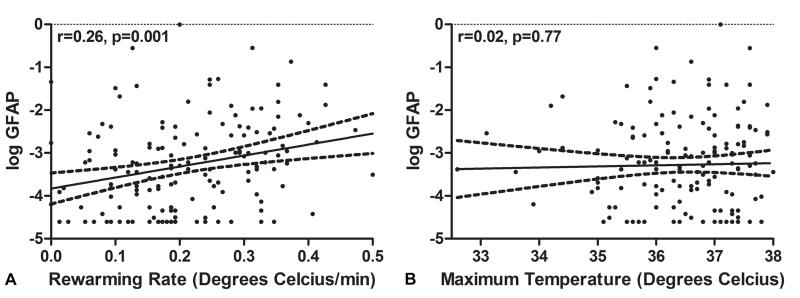
Figure 2.
Scatter plot of glial fibrillary acidic protein (GFAP) with rewarming rate (A) and maximum temperature (B). The long dash line represent 95% confidence interval for the fitted line. There was a significant correlation between log GFAP and rewarming rate (r=0.26, 95%CI, 0.11 to 0.41, p=0.001). There were no significant correlation between log GFAP and maximum temperature (r=0.02; 95%CI, −0.14 to 0.18; p=0.77).

