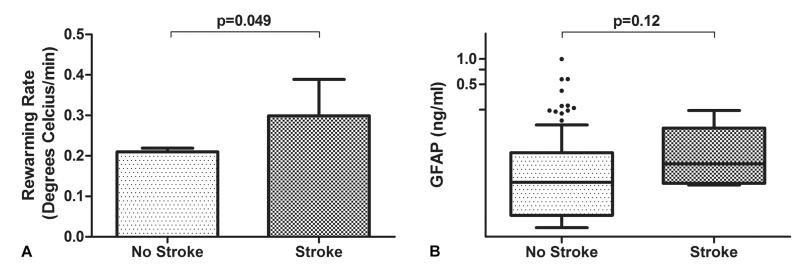
Figure 3.
Bar graph (A) and box and whisker plot (B) showing the relationship between rewarming rate (p=0.048) and plasma glial fibrillary acidic protein (GFAP) levels for patients with and without postoperative stroke. For the latter, the horizontal line in the shaded box for the box and whisker plot represents the median value, and the shaded box represents the interquartile range. The error bars below and above the shaded area represents ±1.5× the interquartile range; points beyond the error bar are outliers.

