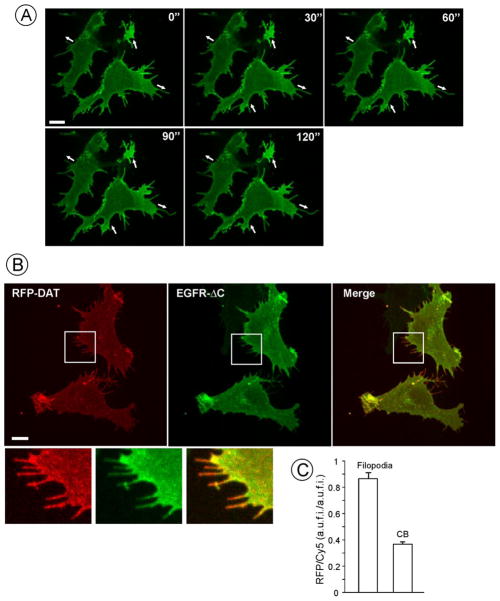
Figure 2. DAT is enriched in filopodia.
(A) 4-D (3D and time-lapse) live-cell imaging of PAE/YFP-HA-DAT cells was performed at 37°C. Maximal projection images of the z-stack are presented. Individual time frames are shown. Times are in seconds. See Supplemental video S1. Arrows indicate protruding and retracting movements of membrane extensions. Scale bar, 10 μm.
(B) RFP-HA-DAT and EGFR-ΔC were transiently expressed in PAE cells, cells were fixed and stained with Ab528 (1 ng/mL) and Cy5-conjugated secondary antibody. 3D images were acquired through 561 and 640 filter channels. Maximal projection image is presented. Insets show high magnification of the region marked by the white rectangle to demonstrate enrichment of RFP-HA-DAT in distal filopodia regions as compared to EGFR-ΔC. Scale bar, 10 μm.
(C) Quantification of RFP/Cy5 fluorescence ratios in filopodia and other parts of the cells (“cell body”, CB) in images presented in A. Graph bars represent mean values (+S.E.M.) of the RFP/YFP ratios from 30 filopodia or regions of interest (ROI) within CB. A.u.f.i., arbitrary units of fluorescence intensity.

