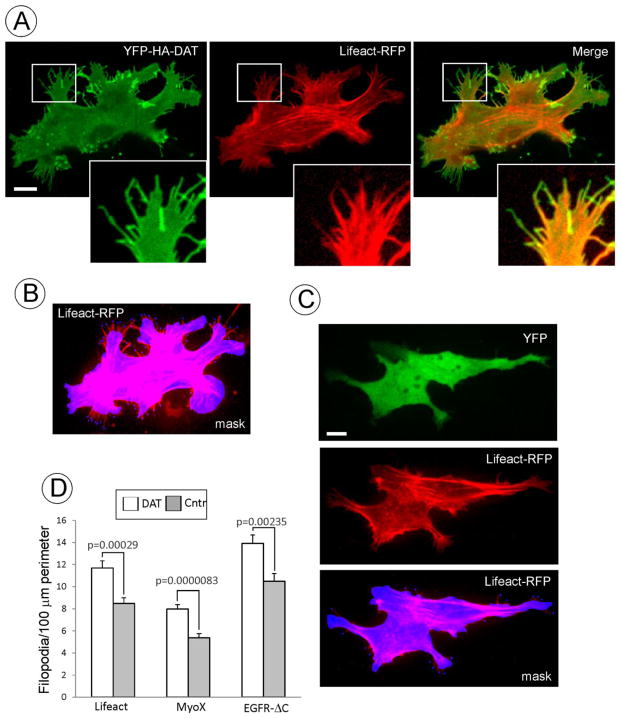
Figure 4. DAT induces filopodia formation.
(A) YFP-HA-DAT and Lifeact-RFP were transiently expressed in PAE cells. Z-stack of 10 confocal images (400 nm stepsize) of living cells was acquired through 515 (YFP) and 651 (RFP) channels at 37°C. RFP image is presented with the gamma for the 561 channel set to 0.5 to allow for better visualization of the low-intensity Lifeact-RFP signals in filopodia without interference of the bright signal of the cell cortex. Insets show high magnification of the region marked by the white rectangle to demonstrate enrichment of YFP-HA-DAT in distal filopodia regions compared to Lifeact-RFP.
(B) Example of the selection mask used for counting peripheral filopodia. Mask was manually generated by encircling the perimeter of the cell Lifeact-RFP fluorescence. Filopodia extending for more than 2 μm outside of the mask were marked. Perimeter of the cell body was calculated, and the number of filopodia was counted using the SlideBook statistics module. In the example presented, there are 11.6 filopodia per 100 μm of cell perimeter.
(C) YFP and Lifeact-RFP were transiently expressed in PAE cells. Image acquisition and presentation are identical to (A) and (B). In the example of the selection mask used for counting peripheral filopodia (as described in B), there are 4.5 filopodia per 100 μm of cell perimeter.
(D) Quantifications of the filopodia density (number per 100 μm of cell perimeter) were performed as described in B and C. These calculations were carried out in living cells co-expressing Lifeact-RFP with YFP (Cntr) or YFP-HA-DAT; PAE/YFP-HA-DAT and parental PAE cells (Cntr) by immunostaining (performed similar to Fig. 1A) and counting MyoX decorated filopodia; and in cells transiently co-expressing YFP-HA-DAT and EGFR-ΔC (see examples of images in Fig. 2A). Graph bars represent mean values (+/−S.E.M.) of filopodia number per cell perimeter from 30–40 cells in each experimental variant.
Scale bars, 10 μm.

