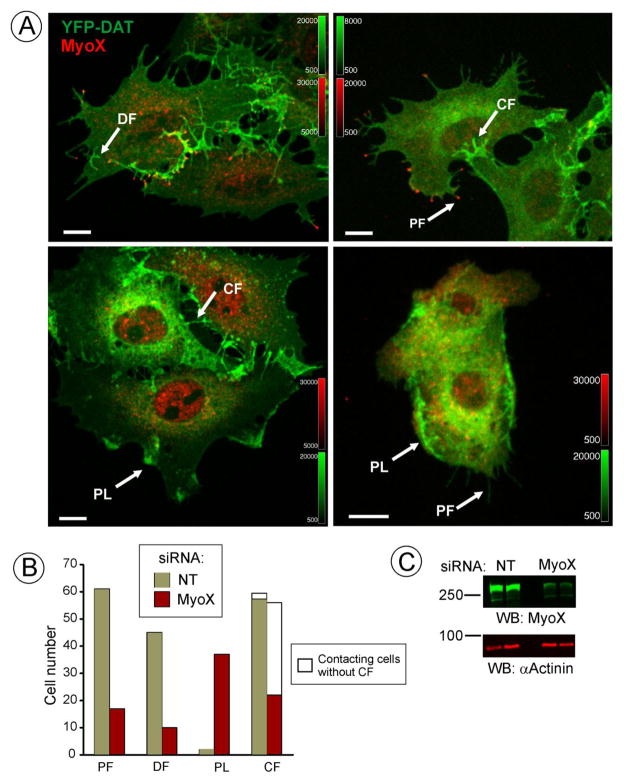
Figure 5. Effect of MyoX knockdown on DAT-containing filopodia.
(A) PAE/YFP-HA-DAT cells were transfected with non-targeting (NT) or MyoX siRNAs and used for experiments 3–4 days later. The cells were fixed and immunostained with MyoX antibodies (dilution 1:500) followed by secondary antibody conjugated to Cy3. 3D images were acquired through 561 (red, MyoX) and 515 (green, YFP) channels. Two examples of control and MyoX-depleted cells are shown. Maximal projection of the z-stack is presented. Examples of peripheral (PF), dorsal filopodia (DF), filopodia connecting two cells (CF) and peripheral lamellopodia-like structures (PL) that were scored in individual cells for calculations presented in (B) are indicated by arrows. Scale bars, 10 μm.
(B) Calculations from two experiments in PAE/YFP-HA-DAT and PAE/RFP-HA-DAT cells performed similar to the experiment presented in (A). Total 3-D images of 65 NT- and 65 MyoX-siRNA transfected cells were analyzed in a blind fashion. The results are presented as numbers of cells that manifest DAT-rich peripheral filopodia (PF) (>5 PF per cell), dorsal filopodia (DF) (>2 DF per cell), peripheral lamellopodia-like structures (PL) (>1 PL per cell), cell-cell connecting filopodia (CF) (>3 per cell) and cells contacting other cells but not having CFs, all exemplified in (A).
C, Western blot detection of MyoX and α-actinin (loading control) in cells transfected with NT or MyoX siRNA. Duplicates are presented. The averaged knock-down efficiency in multiple experiments was 85.5% +/−6.2% (S.D.).

