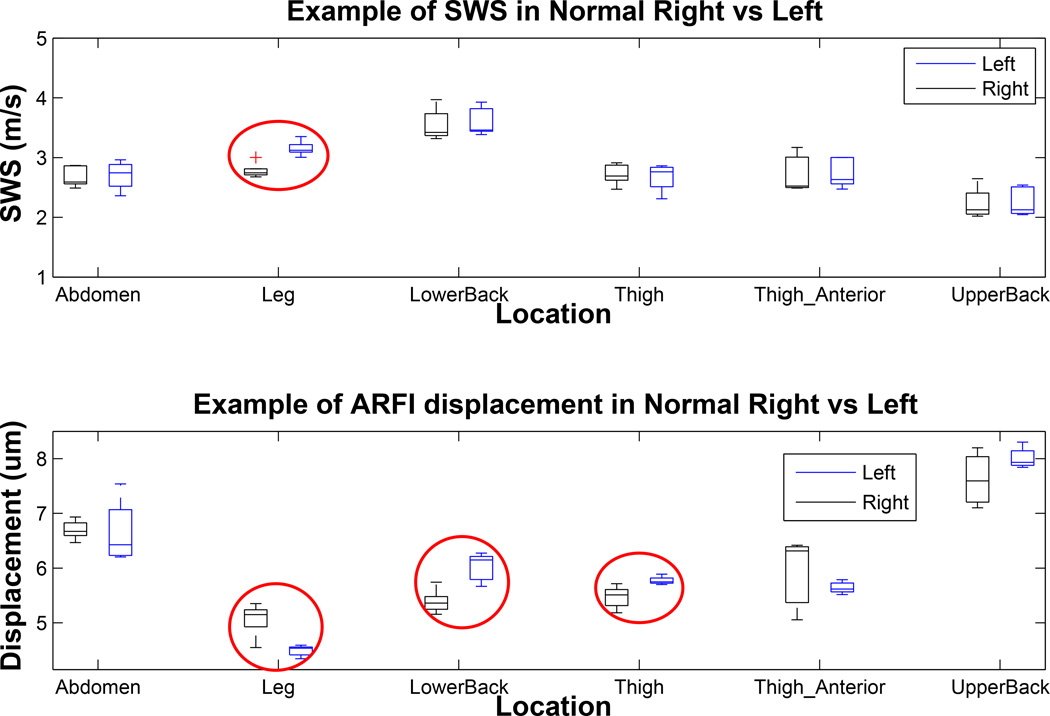
Figure 5.
Shear wave speed and Acoustic Radiation Force Impulse (ARFI) displacement comparison in contralateral right/left pairs in different body locations of a normal control study subject. The top plot shows the range of shear wave speeds reconstructed in left and right pairs of normal skin on various body sites. The bottom plot shows corresponding mean ARFI displacement inside the Region of Interest (ROI). Each box represents distribution of 3–5 individual estimates at an imaging location (total valid acquisition of 55 for this subject). All acquisitions were made in a single imaging session. The red circles indicate cases in which the stiffness metrics inside left and right contralateral sites were significantly different.

