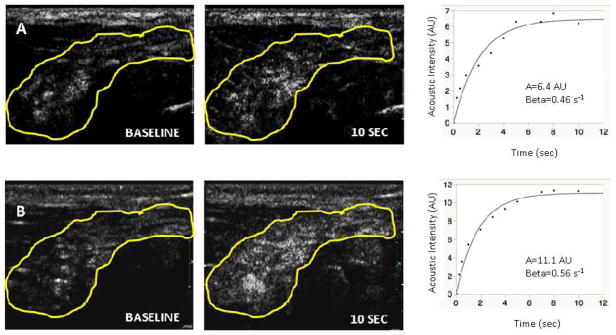
Figure 4.

Acoustic intensity measured in adipose tissue region at baseline and at a triggering interval of 10 seconds in warm conditions (Panel A) and cold conditions (Panel B). Corresponding plotted curves of Aβ (AU/sec) are provided for warm conditions and for cold conditions, adjacent to the respective panels.
