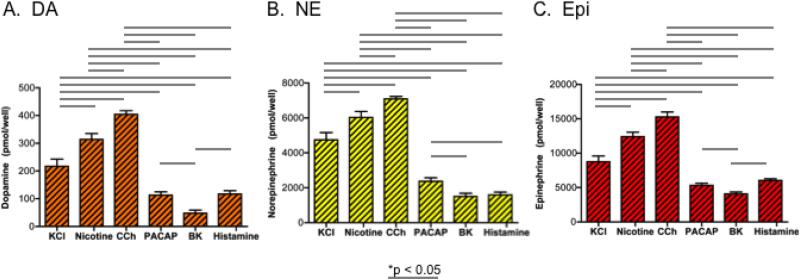
Figure 4. Secretagogue differences in stimulated amounts of catecholamines secreted.
Differences between different secretagogues for stimulation of different amounts of secreted catecholamines are shown for dopamine (DA), norepinephrine (NE), and epinephrine (Epi) in panels A, B, and C, respectively. Secretagogue-stimulated catecholamine amounts were calculated from the measured catecholamine levels in the media of secretagogue-treated chromaffin cells, with subtraction of the basal levels of catecholamines secreted in the absence of secretagogue. One-way ANOVA analyses indicated significant differences among pairs of secretagogues for stimulated catecholamine secretion, shown by the lines with *p < 0.05.

