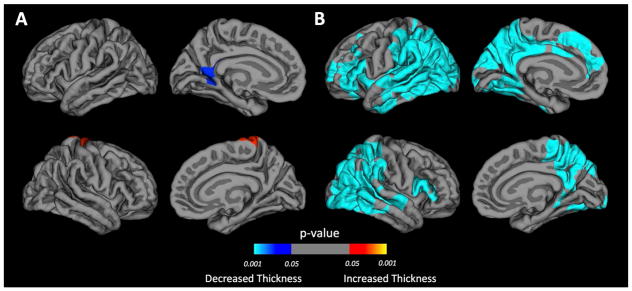
Figure 3. Prospective change in cortical thickness for each group.

Areas of cortical thickness change identified by whole brain vertex-wise analysis in BECTS (A) and healthy controls (HC) (B). The color of the scale bar indicates the statistical significance of the clusters. Blue-cyan represents cortical thinning; red represents cortical thickening. Cluster-wise corrected for multiple comparisons at p<0.05. Corrected for baseline differences in cortical thickness, age and gender.
