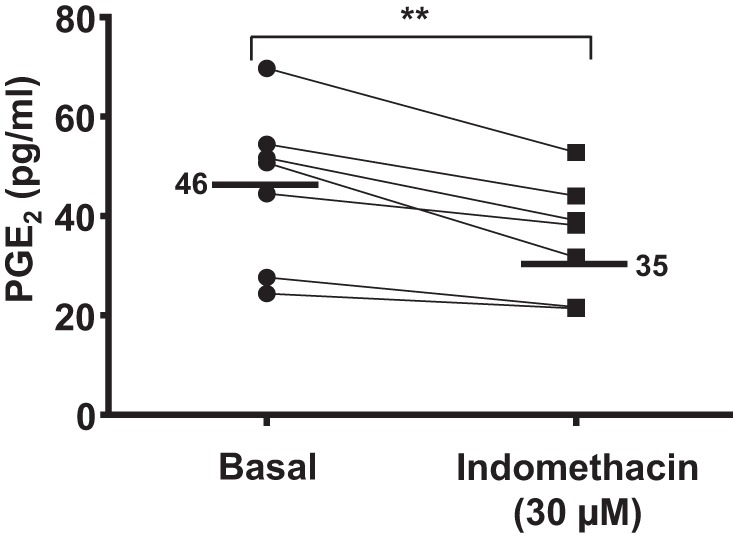
Fig. 4.

PGE2 concentration in the experimental perfusate before and during exposure to the nonselective NSAID indomethacin. The line graph shows the basal concentration of PGE2 and the PGE2 concentration in the perfusate during exposure to indomethacin (30 μM). Mean basal and indomethacin-exposed values are denoted by black lines. In the presence of indomethacin, there was a significant reduction in PGE2 compared with basal levels. n = 7 slices and n = 4 animals. **P < 0.01.
